Performance Testing Spring Boot with Gatling
 Pete Hampton
Performance testing is hard and there is no one established practise for doing it so it's not uncommon to find developers resort to guesswork and experimentation. This can lead to falling into the unproductive trap of over-optimization and missing the primary pain points causing poor performance in the first place. This includes practices such as premature tuning of the JVM before looking for poorly performing code.
A popular method for Rest API performance evaluation is Load Testing, which involves subjecting an application to simulated load. This load could be many things depending on the application e.g web traffic for a public-facing API or trading data for a financial system. Developers do this to understand how their applications might perform in a production environment and to identify slow responses and crashes. This has led to load testing tools like Gatling to be run against Dev/UAT environments, CI pipelines such as Jenkins and QAs executing manual / automated test strategies. Opsian, a continuous profiling system is best suited for production profiling but can also be used in a pre-prod environment to catch performance issues before a go-live.
In this article we develop a simple Spring Boot Rest endpoint that returns a random number and puts it on a Kafka topic, load test it with Gatling, and use continuous profiling to identify hot spots within the code. The code for this article, which will let you reproduce the performance tests, is available on Github.
Setting up the scenario
To initialize a Spring Boot application you can use the Spring Initilizr project which simplifies the setup process. The example in this post uses the Gradle build tool, Java as the language, and Spring Boot 2.2.1. The Spring version should not matter much as long as it is in the 2.X.X series and any modern version of Kafka (>v0.8) should work well. The below Groovy script is the build.gradle file of the project that we have created - we can reduce it to only have 2 dependencies - spring-boot-starter-web and kafka-clients. The Gradle project can now be imported into your IDE of choice.
plugins {
    id 'org.springframework.boot' version '2.2.1.RELEASE'
    id 'io.spring.dependency-management' version '1.0.8.RELEASE'
    id 'java'
}

group = 'com.opsian'
version = '1'
sourceCompatibility = '1.8'

repositories {
    mavenCentral()
}

dependencies {
    implementation 'org.springframework.boot:spring-boot-starter-web'
    implementation 'org.apache.kafka:kafka-clients:2.3.1'
}
In this example REST controller, one method is mapped to an HTTP GET request to the route /random. This simple route, when called, will generate a random number, put it on a kafka topic, and then the return it to the client.
package com.opsian.gatlingtest;

import com.opsian.gatlingtest.kafka.BadKafkaClient;
import org.springframework.web.bind.annotation.GetMapping;
import org.springframework.web.bind.annotation.RestController;

import java.util.Random;

@RestController
public class GatlingTestController {

    private Random random = new Random();

    @GetMapping("/random")
    public int randomNumberHandler() {
        int randomNumber = random.nextInt();
        KafkaClient.sendToKafka(Integer.toString(randomNumber));

        return randomNumber;
    }
}
We also need to create a Kafka client to publish a message onto a topic. Let's use this simple implementation for now.
package com.opsian.gatlingtest.kafka;

import org.apache.kafka.clients.producer.KafkaProducer;
import org.apache.kafka.clients.producer.ProducerConfig;
import org.apache.kafka.clients.producer.ProducerRecord;
import org.apache.kafka.common.serialization.StringSerializer;

import java.util.Properties;

public class KafkaClient {

    private KafkaClient() {}

    public static Properties kafkaProducerProperties() {
        Properties props = new Properties();

        props.put(ProducerConfig.BOOTSTRAP_SERVERS_CONFIG, "localhost:9092");
        props.put(ProducerConfig.KEY_SERIALIZER_CLASS_CONFIG, StringSerializer.class.getName());
        props.put(ProducerConfig.VALUE_SERIALIZER_CLASS_CONFIG, StringSerializer.class.getName());
        return props;
    }

    public static void sendToKafka(String event) {
        KafkaProducer<String, String> producer = new KafkaProducer<>(kafkaProducerProperties());
        ProducerRecord record = new ProducerRecord<String, String>("random-numbers", null, event);

        producer.send(record);
    }
}
Starting a Spring Boot application is a relatively straight forward task. There is usually a Play button on a modern IDE or it can be started with the gradle:bootRun task from the command line.
Once the application is running you can visit http://localhost:8080/random in the browser and see a random number.
If you keep refreshing you should see new numbers are generated and in the background, they should be added to the random-numbers Kafka topic.
Load testing with Gatling
Tools such as Gatling usually adopted to help developers understand how their application performs under 'simulations' before a prod deployment and can help to see if there are slow response times and crashes. A load test stage can also make it into a build process alongside the execution of automated tests to see if checked in code has adversely impacted performance. As we have developed a RESTful API it is worth testing how the application acts when exposed to simulated user usage. For example, 300 users all accessing our endpoint at once.
Depending on the host operating system the binary to install is different, but the concepts described in this section remain the same. Gatling can be downloaded and set up quickly with instructions on their download page. Once Gatling is installed we can write our first simulation script in Scala. It should be noted, for the brevity of this post that we aren't giving a full tour of Gatling's capabilities and it's true potential. You can find more information on this tool on their website for going beyond simple simulations.
If we create a file called GatlingTestSimulation.scala in the user-files/gatlingtest/ directory and add the below Scala code to the file we should be able to run our simulation.
package test

import io.gatling.core.Predef._
import io.gatling.http.Predef._
import scala.concurrent.duration._

class GatlingTestSimulation extends Simulation {

  val httpProtocol = http
    .baseUrl("http://localhost:8080")
    .acceptHeader("text/html,application/xhtml+xml,application/xml;q=0.9,*/*;q=0.8")
    .doNotTrackHeader("1")
    .acceptLanguageHeader("en-US,en;q=0.5")
    .acceptEncodingHeader("gzip, deflate")
    .userAgentHeader("Mozilla/5.0 (Macintosh; Intel Mac OS X 10.8; rv:16.0) Gecko/20100101 Firefox/16.0")

  val scn = scenario("Scenario Name")
    .exec(
      http("random_request")
        .get("/random")
    )

  setUp(scn.inject(atOnceUsers(300)).protocols(httpProtocol))
}
To run the above Gatling simulation we can run
bin/gatling.sh -s test.GatlingTestSimulation
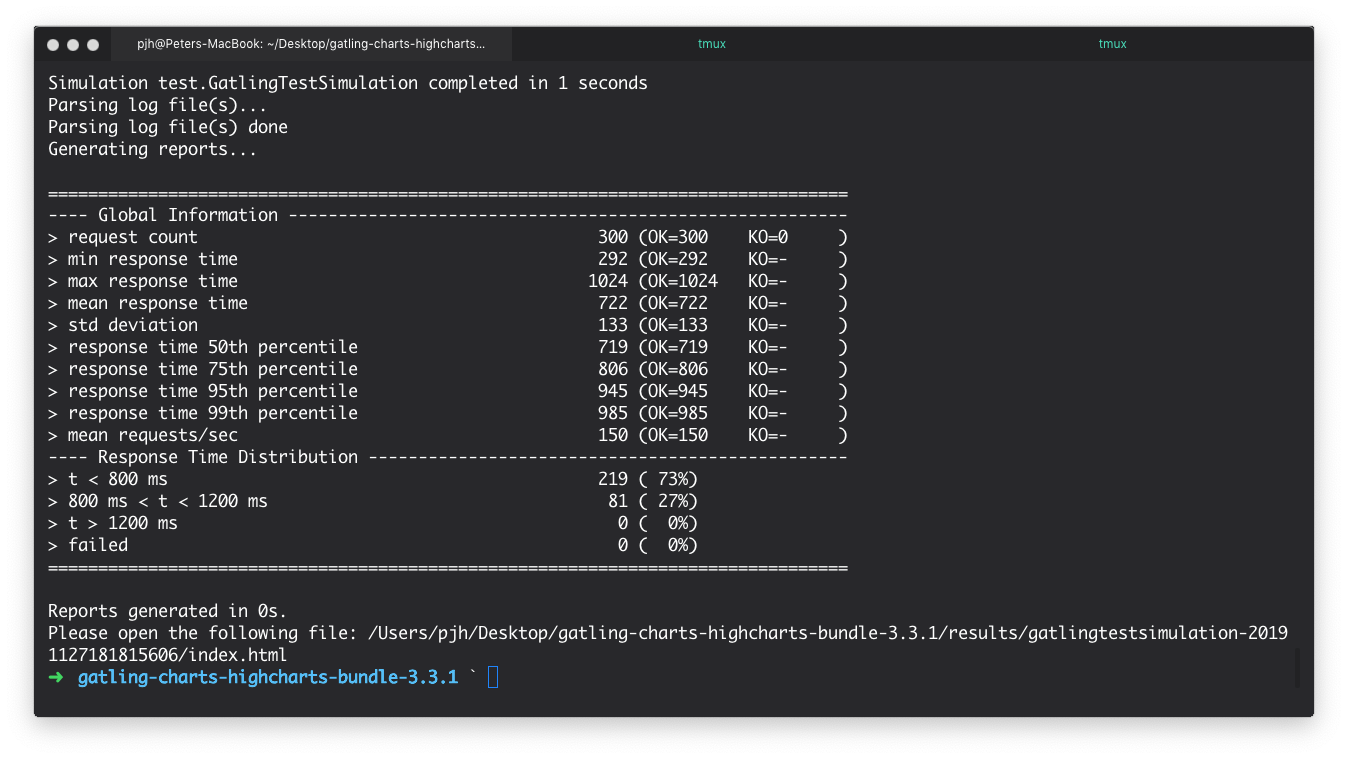
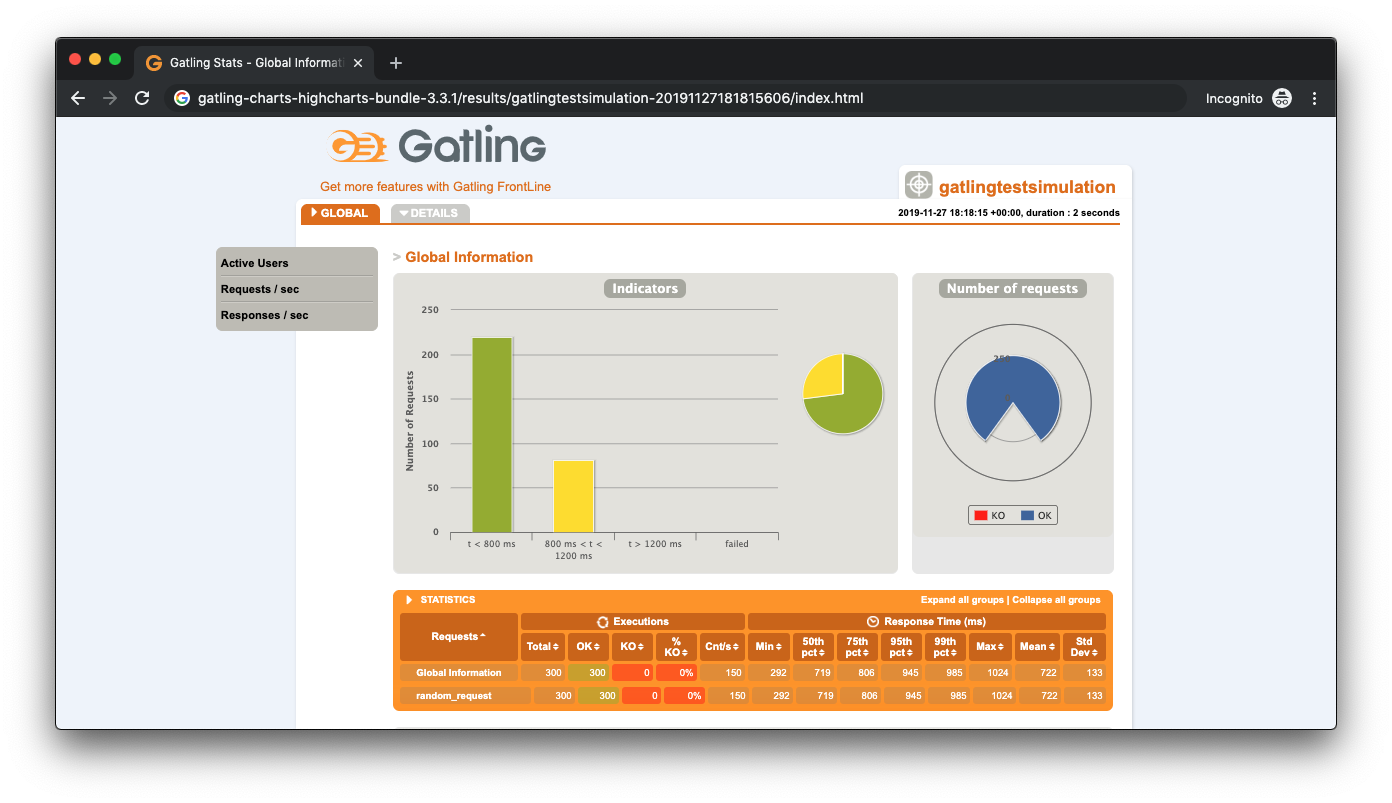
Once Gatling has finished sending the requests it generates a report in the terminal and also creates a report. These can be seen from the below images.
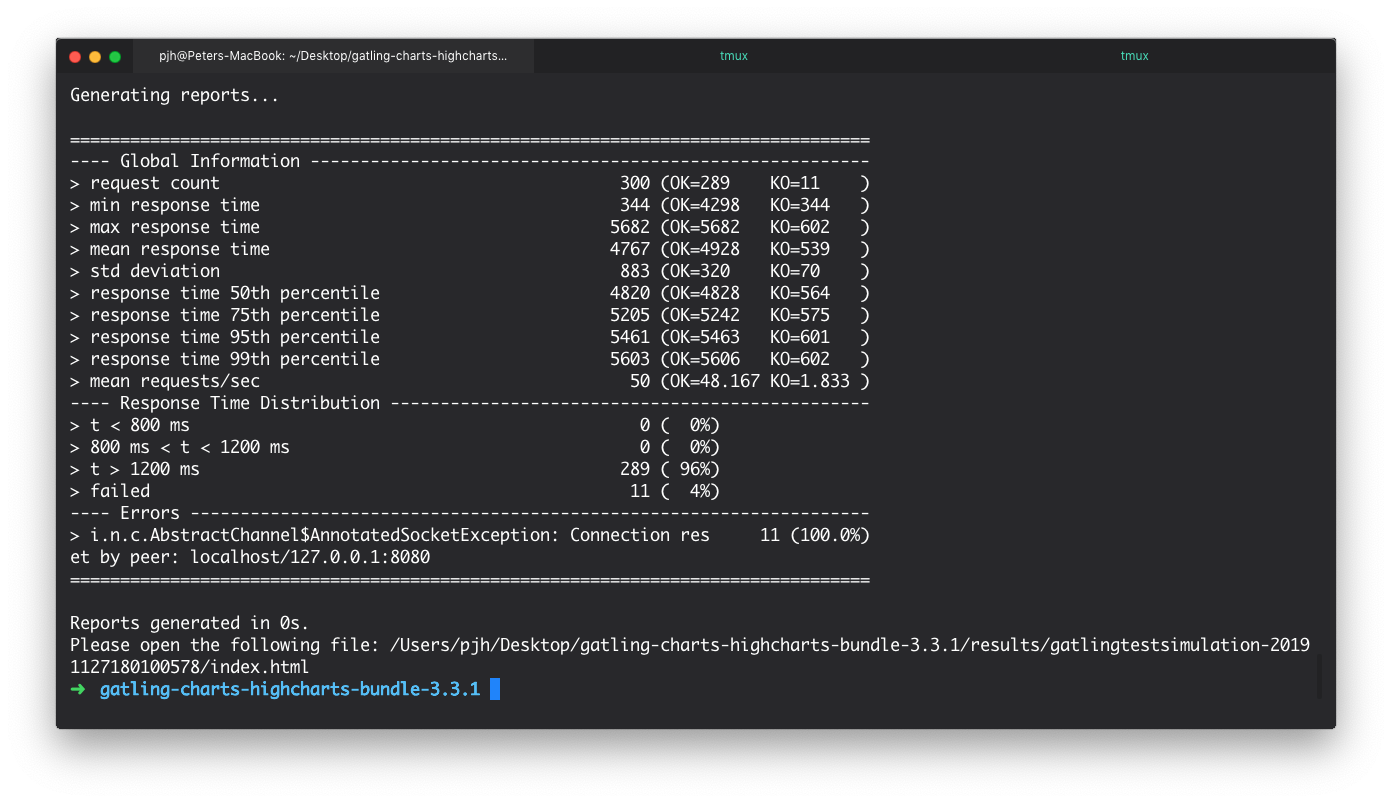
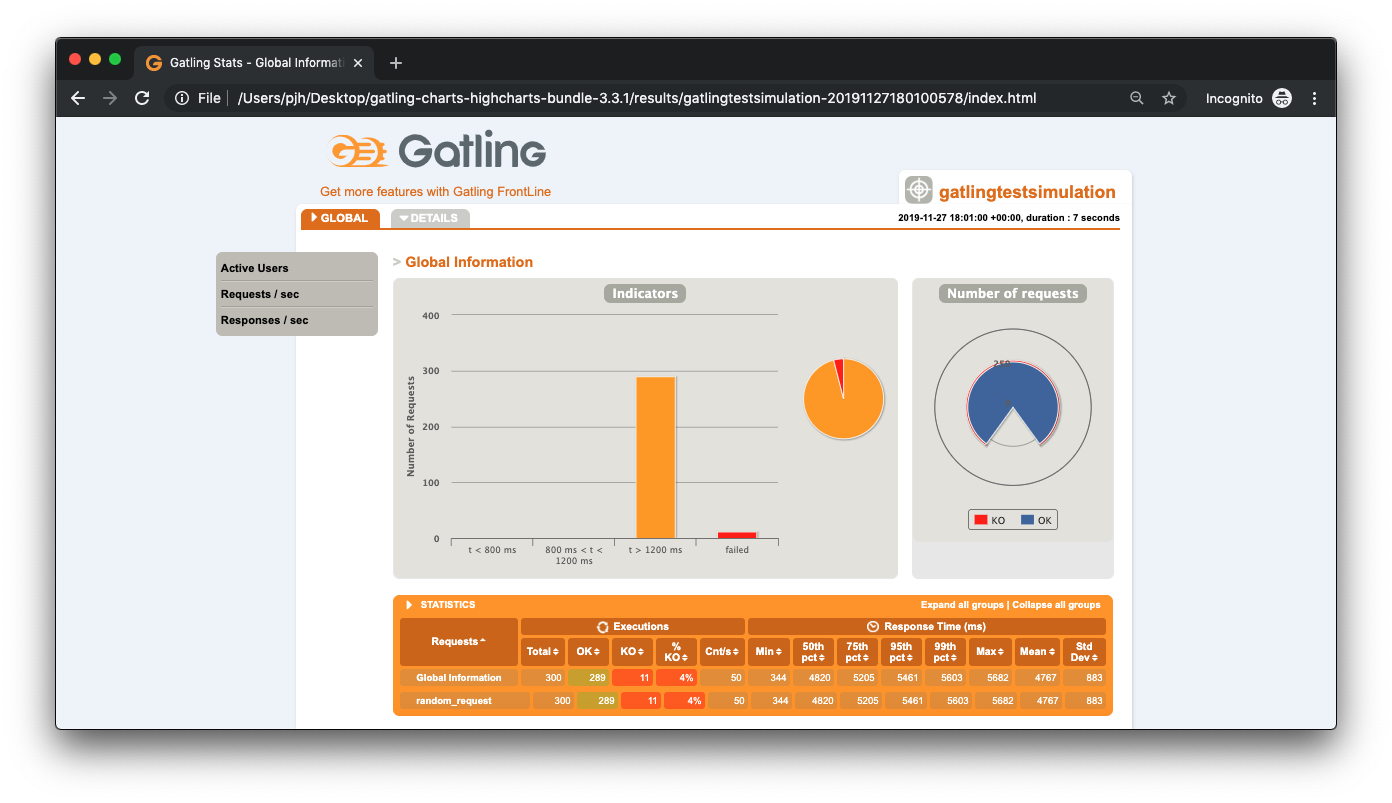
Although there is much more to the report, we can see that out of 300 simultaneous requests to our endpoint - 7 requests failed and on average took >1200 ms to respond. This is a very poor result and if deployed, would mean many unhappy users. Why is this happening? After all, we have written very little code. As a developer, you might be wondering if it is the JVM. Should we start tuning it? Maybe it's Kafka? Our dev environment?
A seasoned programmer knows our first port of call should be looking at the code that we as the developer have under our control. Gatling only measures the request/response statistics from the endpoint. To explore the code itself we need to go deeper. We need a profiler.
Continous Profiling with Opsian
Opsian is a continuous profiler for the JVM. It consists of a lightweight JVM agent that transmits profiling data to a central system that indexes and makes it available via browser-based dashboards.
It is designed for use in production environments but we can also use it in situations like this load test to understand what the system is actually doing.
For a deeper explanation see the blog post What is Continuous Profiling?.
Once the API key has been sourced, the uberjar can be created with the gradle:assemble task.
Although Opsian works well on most Linux distributions we will use Docker to set up. The contents of the Dockerfile could be something a simple as this:
FROM openjdk:8-jre

RUN groupadd -g 999 opsianuser && \
    useradd -r -u 999 -g opsianuser opsianuser
USER opsianuser

COPY /gatlingtest.jar /app.jar
COPY /libopsian.so /libopsian.so

CMD ["java", "-agentpath:/libopsian.so=apiKey=${OPSIAN_SECRET},applicationVersion=1", "-jar", "/app.jar"]
The above Dockerfile assumes that the libopsian binary and assembled jar in the root of the codebase. It can be built with the following command:
docker build -t opsian/gatlingtest:v1 .
Once the image has been successfully created we can boot the container with:
docker run -it -p 8080:8080 opsian/gatlingtest:v1
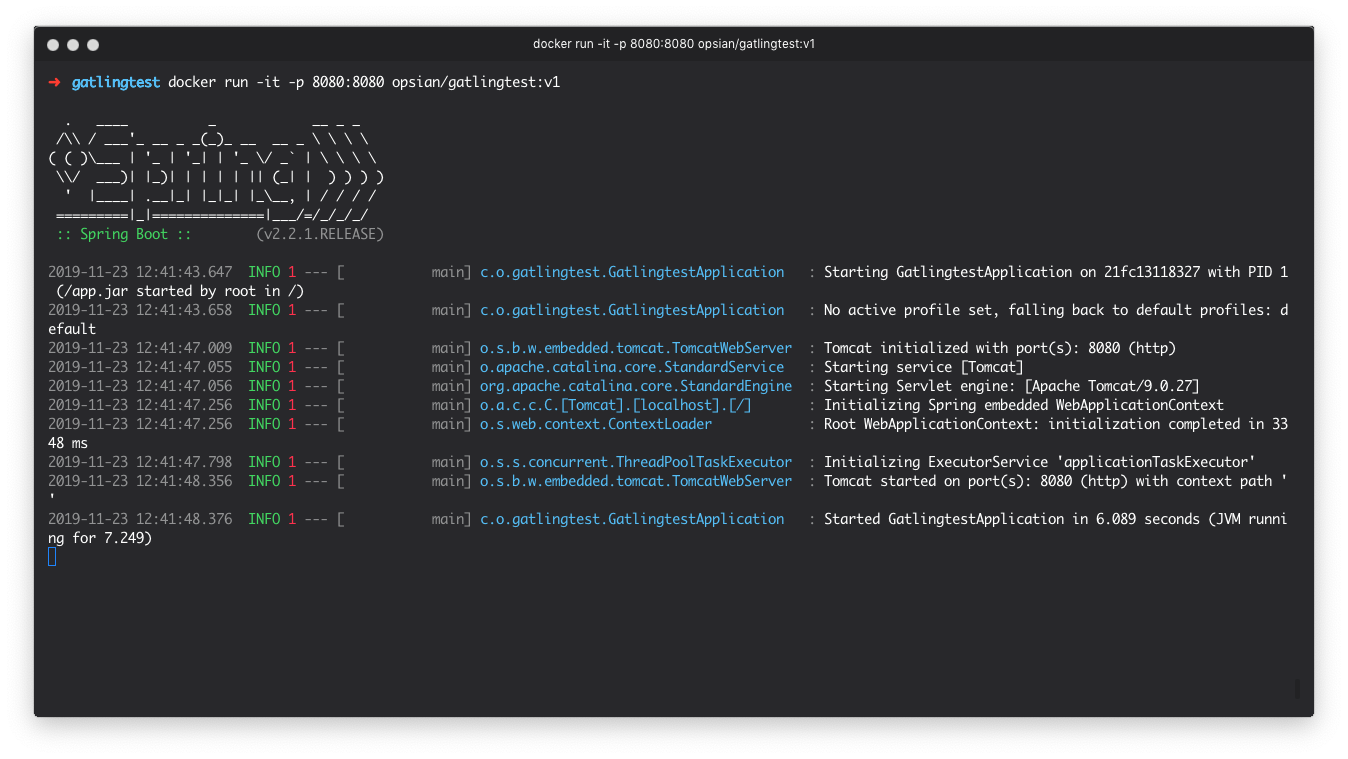
If we re-run our Gatling simulation from the previous section we can see that the information is sent to Opsians servers where we can investigate the runtime and any hotspots.
We are now in a position to run the Gatling simulation again and view the results in Opsian. With very little effort Opsian helps us identify potential performance bottlenecks in the code and can point to the methods being executed. We can visualize the execution with Flame Graphs, Tree Views and Hot Spots - diagrams which both technical and non-technical team members can analyze. A related post includes Always-on production Flame Graphs for Java which explains the visualization in depth.
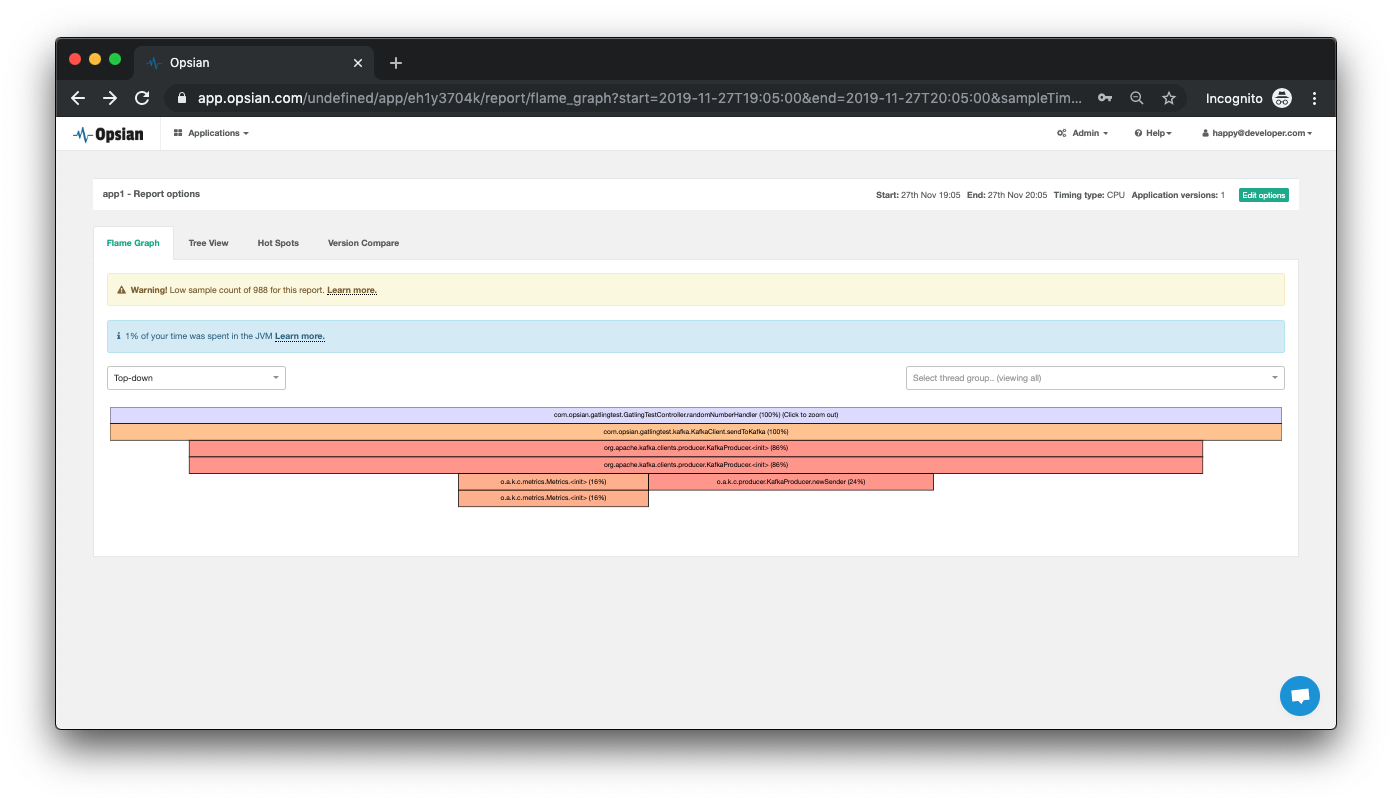
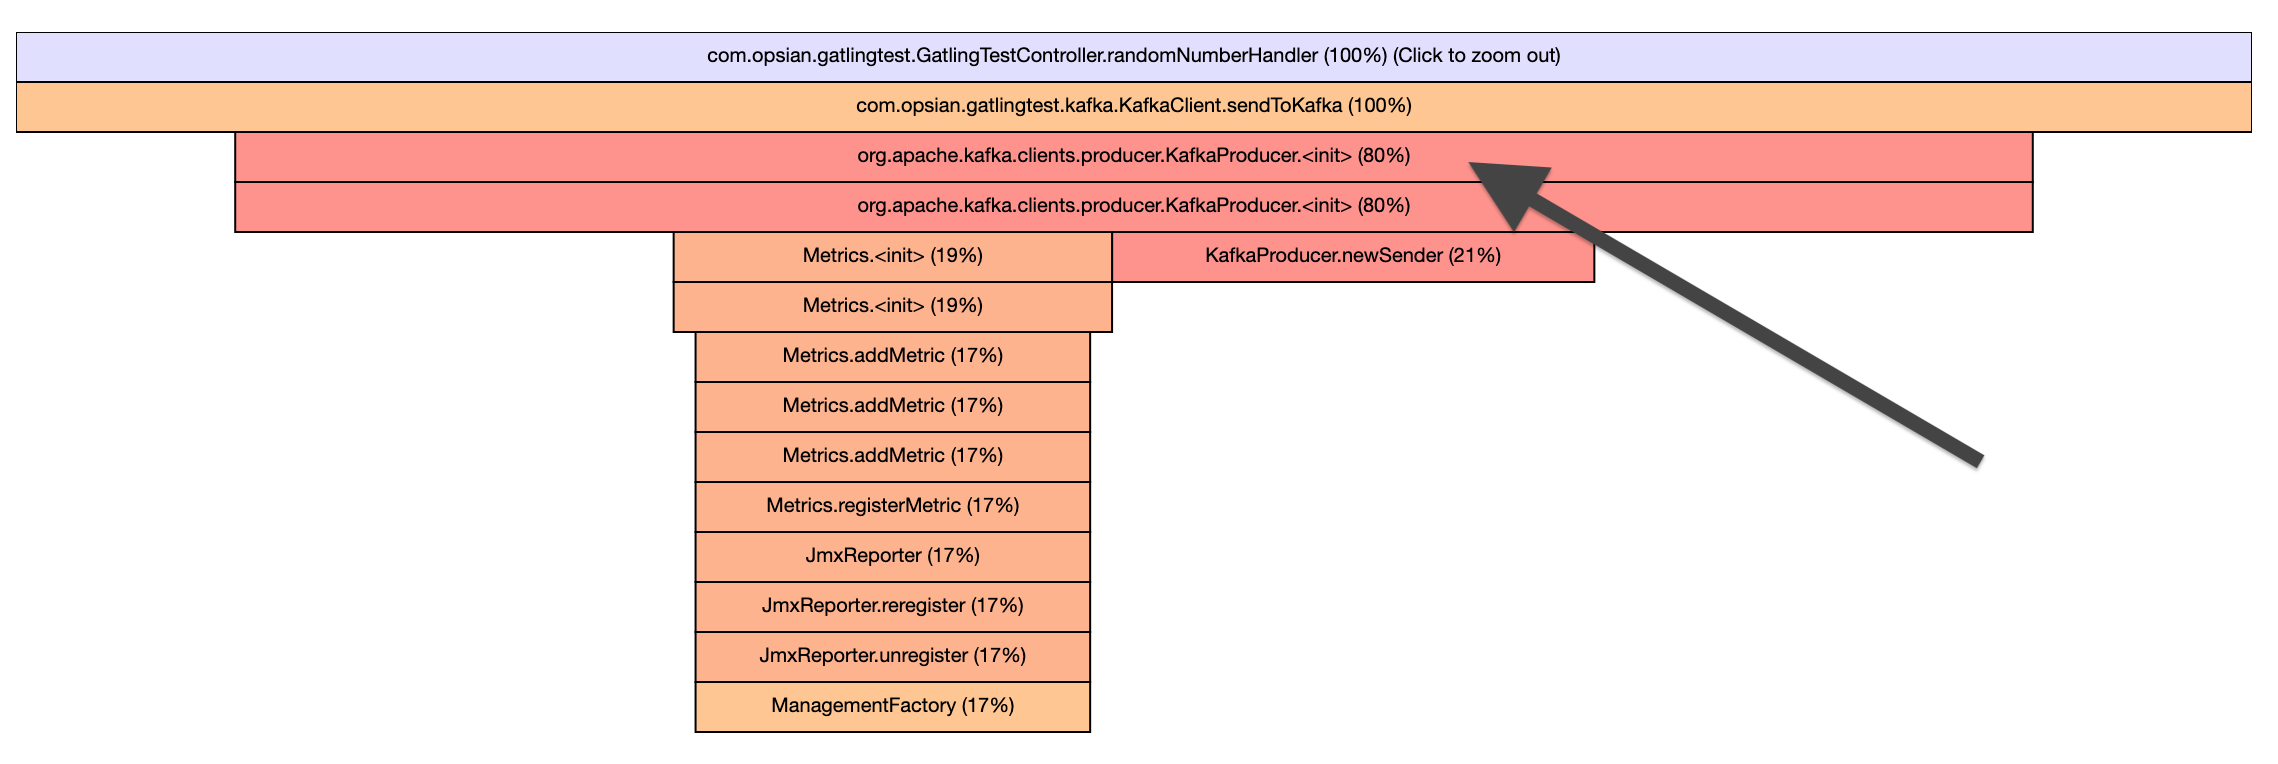
When we connected to Opsian and viewed the Flame Graphs in the user interface we can see that the Kafka record dispatch is appearing to be a bottleneck. It seems from the data collected by Opsian that 86% of the CPU time spent servicing a request is being spent initializing a KafkaProducer.
Refactoring and Retesting
This was a bug observed in a real-life production system which is performance dependant. It's not uncommon for erroneous code to be introduced to a codebase when developers are not familiar with an API and / or have tight deadlines imposed on the team.
As Opsian has suggested from the Flame Graph, we can see that the sendToKafka is creating a new KafkaProducer in every request! We can fix this by making this a non-singleton class and creating 1 Kafka Producer.
public class KafkaClient {

    private KafkaProducer<String, String> producer;

    public KafkaClient() {
        producer = new KafkaProducer<>(kafkaProducerProperties());
    }

    private Properties kafkaProducerProperties() {
        Properties props = new Properties();

        props.put(ProducerConfig.BOOTSTRAP_SERVERS_CONFIG, "localhost:9092");
        props.put(ProducerConfig.CLIENT_ID_CONFIG, "producer");
        props.put(ProducerConfig.KEY_SERIALIZER_CLASS_CONFIG, StringSerializer.class.getName());
        props.put(ProducerConfig.VALUE_SERIALIZER_CLASS_CONFIG, StringSerializer.class.getName());
        return props;
    }

    public void sendToKafka(String event) {
        ProducerRecord record = new ProducerRecord<String, String>("random-numbers", null, event);
        producer.send(record);
    }
}
This allows us to cleanly define the Kafka client (Producer) on start-up of the Spring application.
package com.opsian.gatlingtest;

import com.opsian.gatlingtest.kafka.KafkaClient;
import org.springframework.web.bind.annotation.GetMapping;
import org.springframework.web.bind.annotation.RestController;

import java.util.Random;

@RestController
public class GatlingTestController {

    private KafkaClient kafkaClient = new KafkaClient();
    private Random random = new Random();

    @GetMapping("/random")
    public int randomNumberHandler() {
        int randomNumber = random.nextInt();
        kafkaClient.sendToKafka(Integer.toString(randomNumber));

        return randomNumber;
    }
}
If we re-run our Gatling simulation now we can see that performance has improved significantly with the refactor.
Gatling is especially helpful in scenarios where the process is deployed on a prod-like infrastructure and storing the reports into somewhere like Amazon S3. This allows developers and other interested parties to see if commits have had an adverse effect on the performance of the application. In short, Gatling is great for telling us when we have a problem, and Opsian helps us drill into the underlying performance issues in our software.
Conclusion
In this post we can see Gatling and Opsian complement each other well for load and performance testing a Spring Boot application in a pre-prod environment. We use Gatling to simulate a synthetic workload and Opsian to profile the performance and gain a deeper insight into the code being executed. This could be seen as the first line of defence when testing in a pre-prod environment such as a development or UAT/QA server.
Although issues may be identified it will unlikely reflect the real complexity and uncertain workload found in a production environment. Due to performance issues with profilers in the past, it is believed that continuous profiling is not suitable for production. Opsian addresses this, has been battle-tested in production by numerous companies and has been shown to have less than 1% overhead when running continuously.