What is Continuous Profiling?
 Sadiq Jaffer
&
Sadiq Jaffer
&
 Richard Warburton
The pace of modern development is ever increasing and all too often performance in production is an afterthought - only addressed when there is serious problem. What if there was a technique that could greatly simplifying the process of understanding production performance and enabled teams to address bottlenecks before they came genuine production issues? This article covers a technique that can do just that, read on to understand the what, why and how of Continuous Profiling.
So what is Continuous Profiling? It is the continuous collecting of line-level profiling performance data from a production environment and making available that data to developers and operations teams for rapid analysis.
This stands in contrast to Ad Hoc Production Profiling, which is where a profiler is connected to your production environment on an intermittent as-needed basis. We've found that continuously profiling brings significant advantages over doing it on an ad hoc basis and the later of this post details some of them.
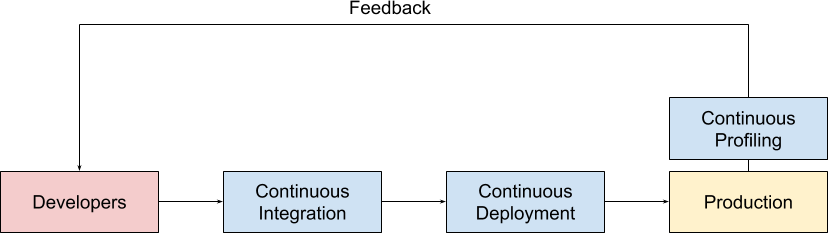
If you're wondering where Continuous Profiling sits compared to other ways of measuring production performance, we have a dedicated blog post that covers just that.
Why do Continuous Profiling?
With a Continuous Profiling system in place, developers can get a line-level understanding of the performance of their code. By performance here, we mean the consumption of some limited resource of interest (whether that's CPU time, wallclock time, memory, disk I/O etc..) which, when exhausted, leads to the system bottlenecking. By identifying and improving the parts of your codebase that use these resources, you can improve scalability, cut costs, increase reliability and speed up how quickly you can recover from performance regressions. The next few sections explain how.
Recover from Performance Regressions quickly
A new deploy makes its way to production and suddenly your metrics are telling you that you're failing all your performance targets. What do you do?
Assuming it is possible to do a clean roll back, the usual response is to immediately roll back the deploy to a previous known-good deploy. Then begins an investigation to try to reproduce the issue in a pre-production environment and find the cause, possibly through profiling. This is often time consuming and there are many subtle aspects to production (both load and the environment itself) that are hard to reproduce in a pre-production. While this investigation is going deployment to produce is often blocked, which can lead to stakeholder frustration.
If it isn't possible to cleanly roll things back then there is usually a frantic process involving pointing at each component and metric in turn trying to find a cause - this may involve connecting a profiler to production to do some ad hoc production profiling. The difficulty with production profiling only when there's an issue is that there are no normal profiles to compare against e.g is this code hotspot the cause of the performance regression or is that just normal behaviour?
With Continuous Profiling, performance data from the current malperforming system can be compared to historical data to rapidly identify the performance regression cause.
Cut server costs and improve scalability
The ability to easily compare performance between releases lowers the work required to find even small decreases in performance and so makes continual performance improvement much more likely. The compound effect of this can lead to significant reductions in server resource utilisation and with the nature of cloud environments organisations increasingly run in, that directly translates to reduced running costs.
Another consideration is that when developer costs are high and performance tuning is labour intensive, it is sometimes not worth the trade-off against infrastructure costs. By reducing the amount of developer time required to do performance work, saving infrastructure costs makes a lot more sense.
The continual reduction and removal of performance bottlenecks can also improve the system's overall scalability in response to growth or fluctuations in demand. As bottlenecks can also become the causes of production incidents when load increases, system reliability is also improved through their removal.
Improved developer mental models
One thing we witness often with an Opsian integration is that developers realise that the assumptions and mental models they use during development for the cost of operations or the nature of data are incorrect. We've seen significant reductions in load from customers simply switching the order of certain filters based on their actual costs in production rather than the assumed cost at development time.
By giving developers access to Continuous Profiling, those mental models and assumptions can be refined over time so that new code and changes more closely match how the production environment actually behaves.
How do I do Continuous Profiling?
Implementing Continous Profiling requires a couple of things:
- A low-overhead production-safe sampling profiler for your language and runtime of choice
- A method or database for storing the data from of your profilers
- A way of generating reports from said data
None of these steps are particularly easy. Finding low-overhead sampling profilers suitable for production can be difficult and for a system to be useful, you may need to deal with and manage a significant amount of profiling data. Many large companies have made significant investments in implementing Continuous Profiling, Google have actually published an article detailing their Google-wide Profiling architecture.
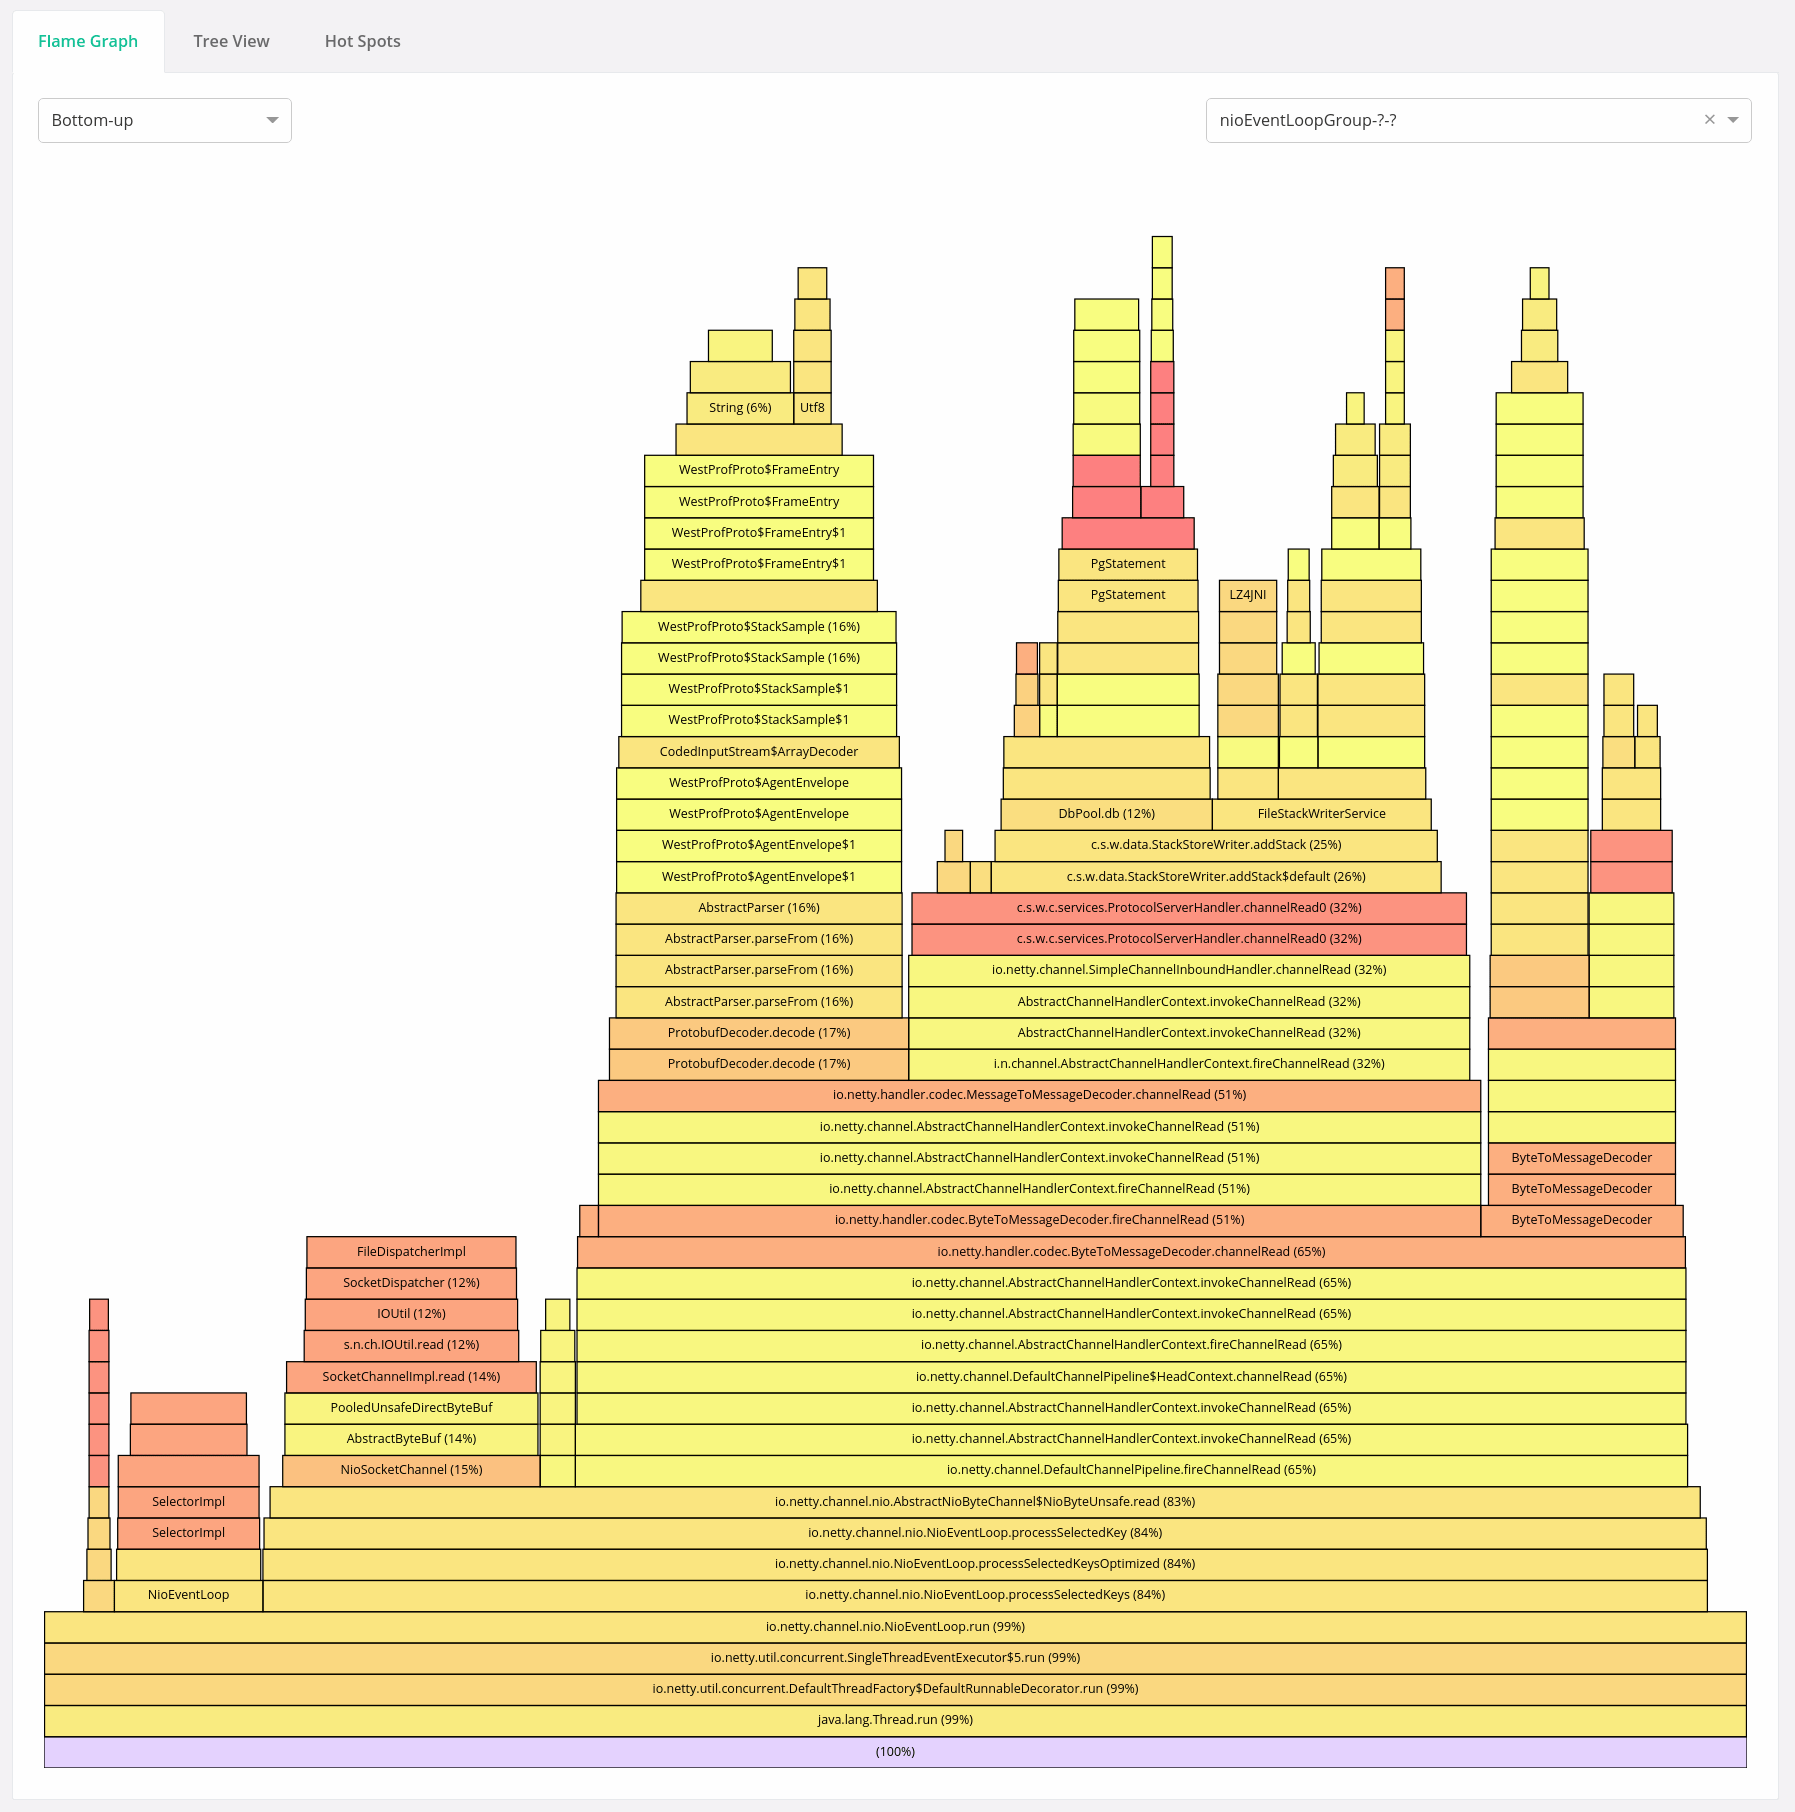
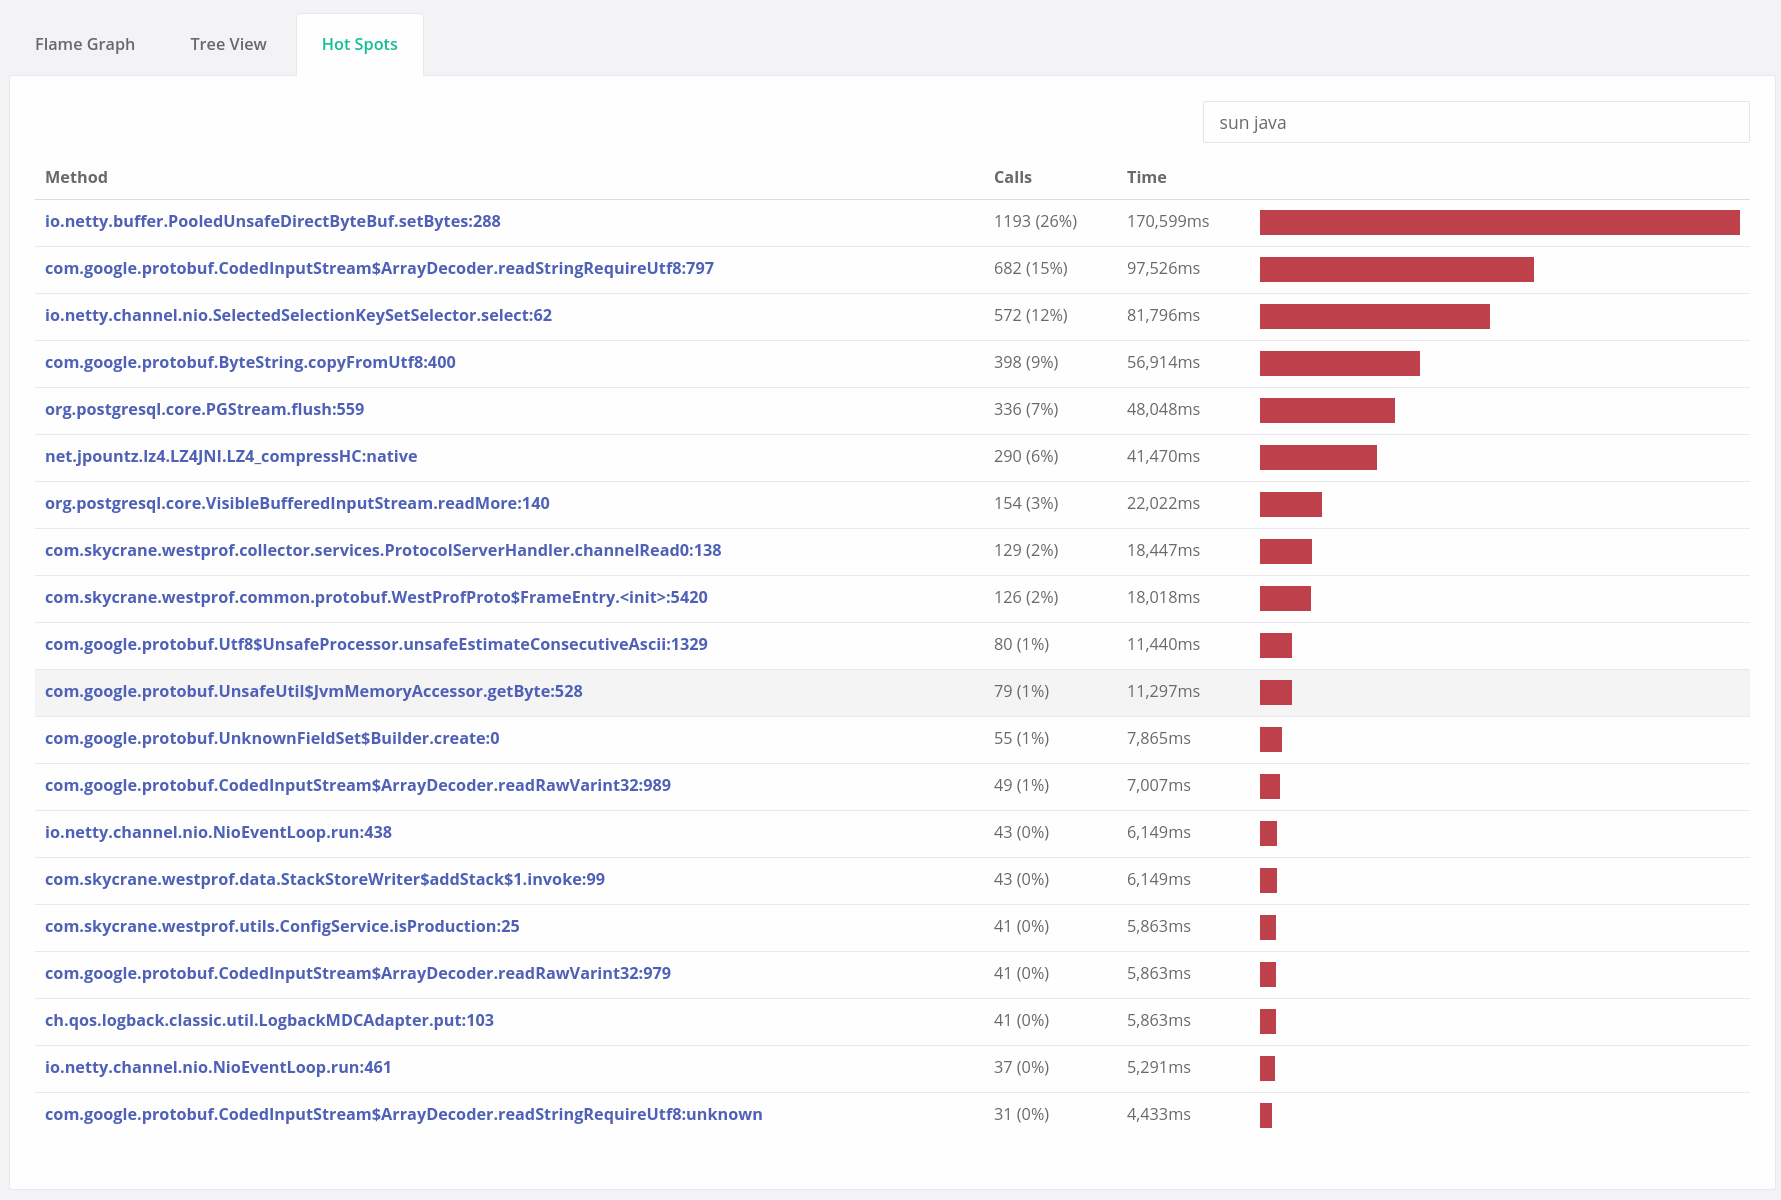
Opsian was founded to make Continuous Profiling significantly easier. We offer a cloud or on-prem Continuous Profiling service for the JVM supporting Java, Scala, Kotlin and Clojure. Our lightweight JVM agents feed performance information into our aggregation service that powers browser-based dashboards giving real-time access to flame graph, hot spot, tree and release comparison reports. If you think your organisation could gain from some of the benefits above, then head over and sign up for a free trial.