Continuous Profiling of a JVM application in Kubernetes
 Pete Hampton
The use of Docker and Kubernetes has been growing in the JVM community over the past couple of years. There are numerous success stories coming out of large companies like Google and distruptive start-ups including Robinhood and Monzo. Encapsulting the application runtime in a container and managing through an orchestrator has numerous benefits including lowering the bar for developers managing insfrastructure and simplifying continuous deployment compared to a traditional setup. Existing software products that have hit scalability issues tend to undergo change and transformation projects where monolithic codebases are shifted to a micro or nano-service architecture and these have a natural fit to something like Kubernetes.
One downside to Kubernetes from a performance optimisation perspective is that it can be harder for developers to get profiling data from their production environment. This blog post aims to show you how to make that easier by continuously profiling using Docker and Kubernetes. We keep it simple and build an application that returns a programming language name from a REST endpoint, containerize it with Docker, deploy it to Kubernetes and profile it with Opsian's continuous profiler. Instead of using Kubernetes on a public cloud such as GCP or AWS this post will focus on deploying to Minikube which can be installed on Windows, Mac and Linux operating systems. This is great if you are learning the ins-and-outs of Kubernetes.
Application Setup
In order to deploy something we will create a simple application that returns a programming language from a RESTful endpoint. For the sake of getting stuff done quickly we will use the Spring Boot JVM framework to build out our application process. This tutorial will also work fine with Kotlin or Groovy as the programming language - however, the gradle build specification may look slightly different. As we are demonstrating the power of containerization and orchastration it will be a simple example which will omit the need for cross-service networking or configuration management with tools such as Consul.
First, start up your favourite IDE. In this walkthough I will use IntelliJ IDEA Community Edition. However, any good modern IDE with Gradle support should suffice.
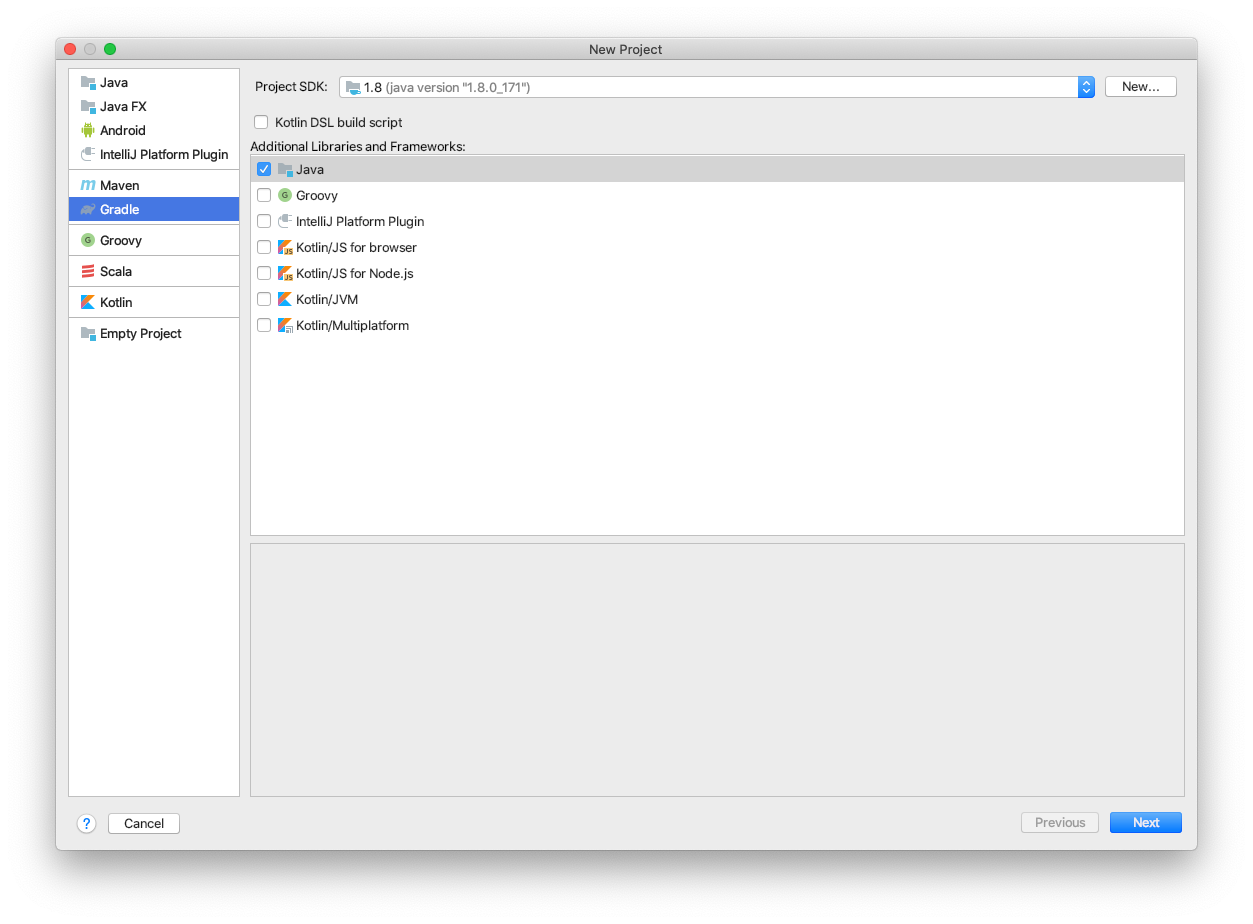
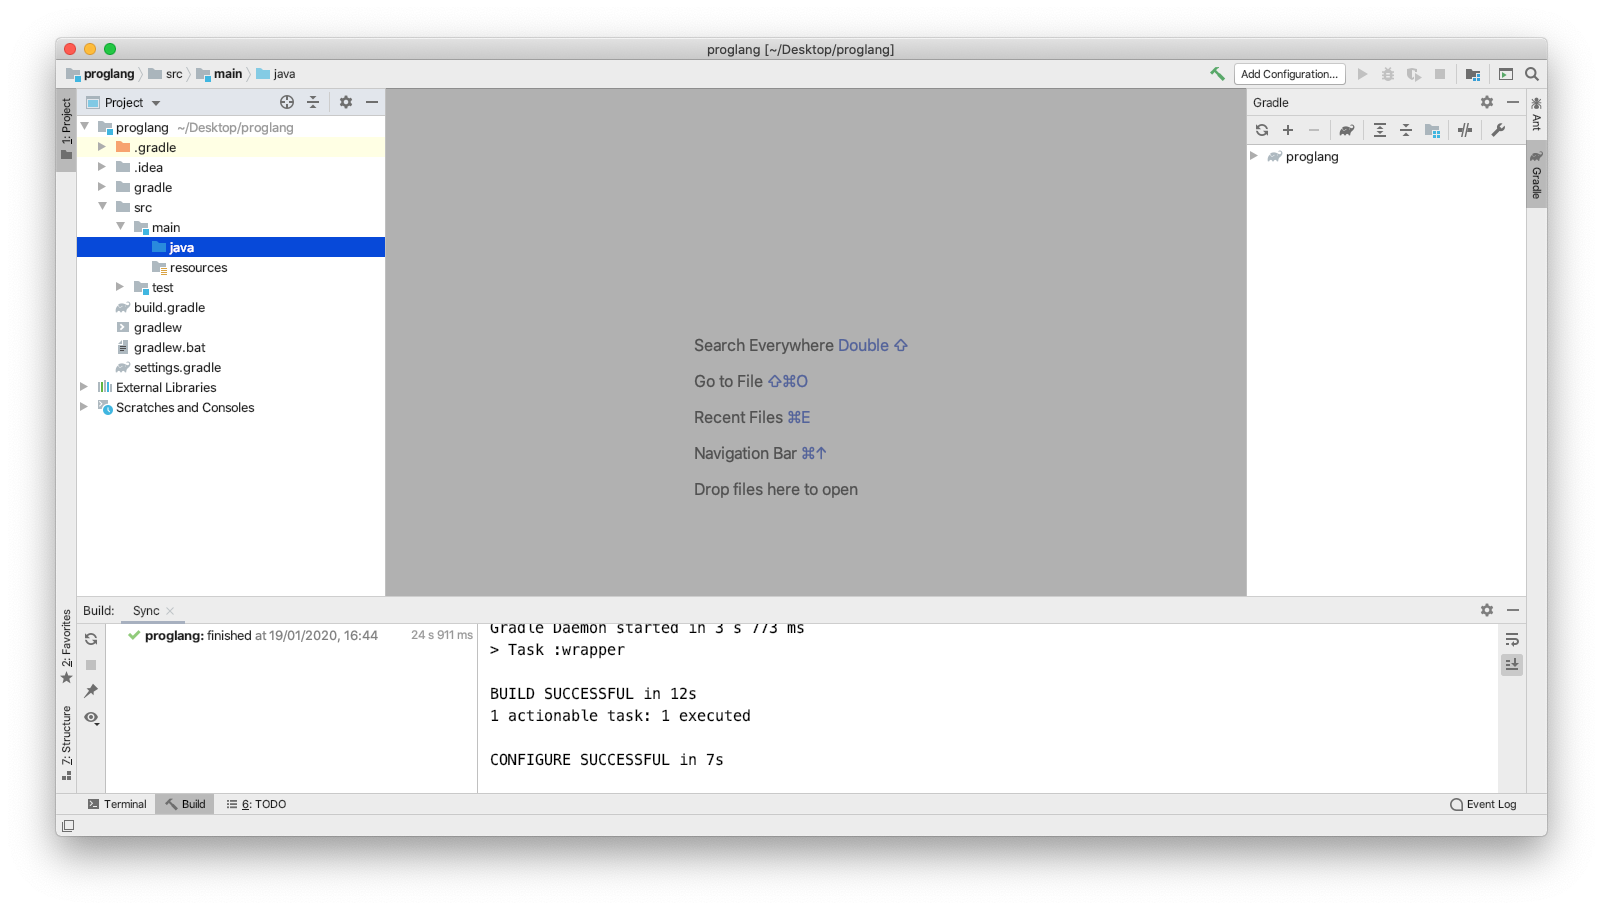
Start off by creating a new Gradle project with Java language support. On a side note I am running a Java v1.8.0_171 JDK, but any Java 8 or Java 11 should also work without issues. Once the project setup has completed your IDE should have a similar directory structure.
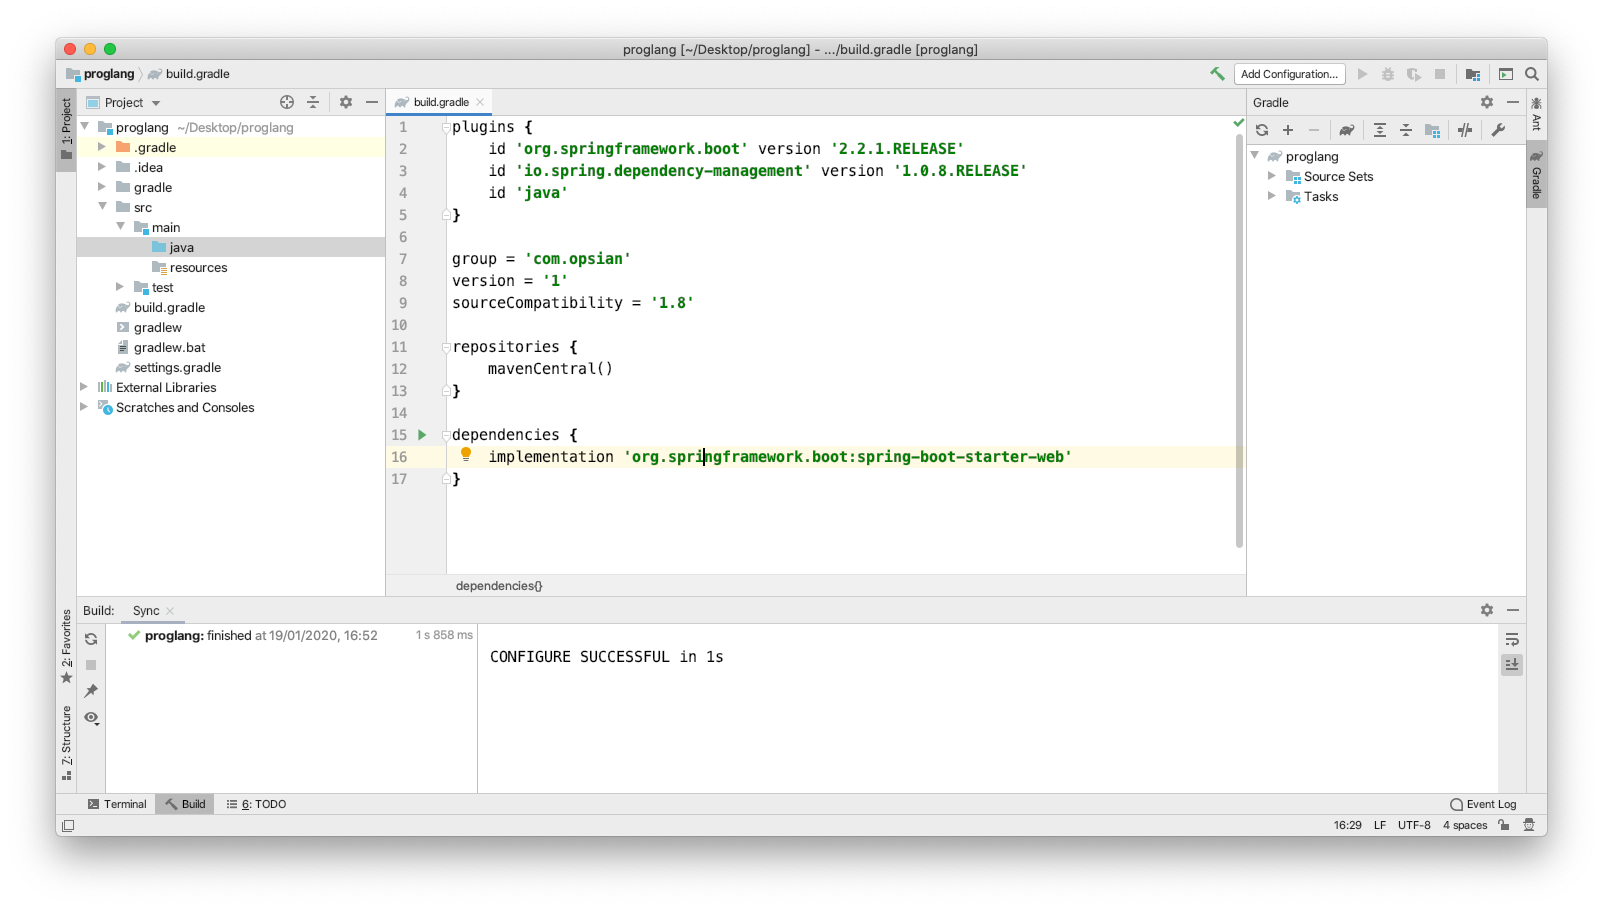
Before the application is built out, we need to add our dependency on the Spring Boot framework. By adding the Gradle plugin for org.springframework.boot we can ommit the need to put a version on our dependency declaration. The code for the build script is as follows:
plugins {
    id 'org.springframework.boot' version '2.2.1.RELEASE'
    id 'io.spring.dependency-management' version '1.0.8.RELEASE'
    id 'java'
}

group = 'com.opsian'
sourceCompatibility = '1.8'

repositories {
    mavenCentral()
}

dependencies {
    implementation 'org.springframework.boot:spring-boot-starter-web'
}
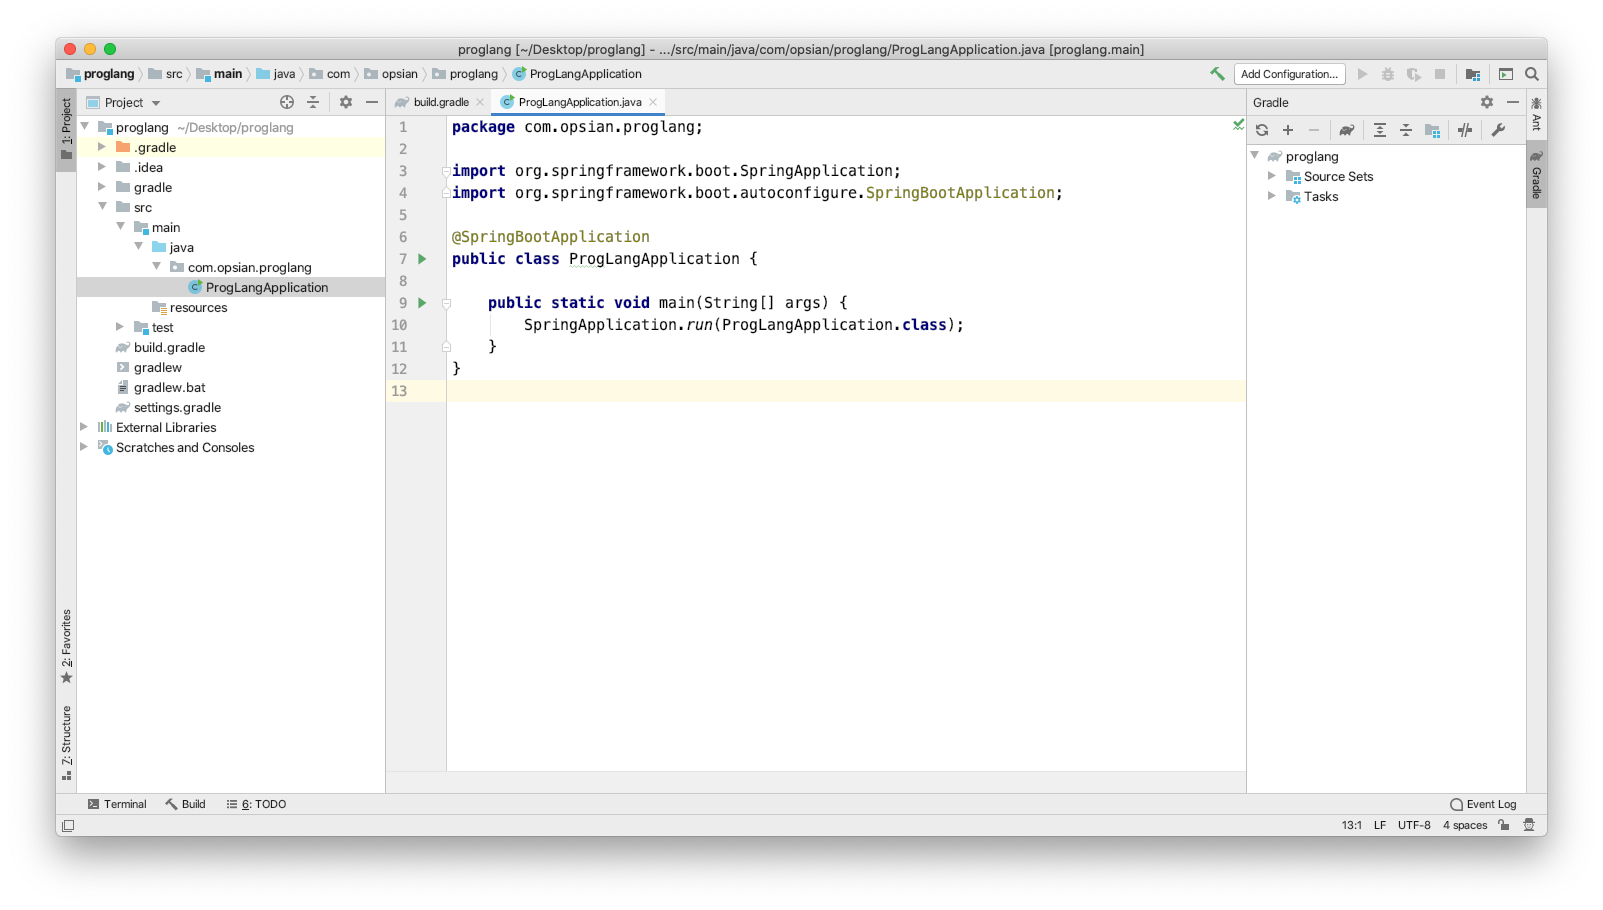
Next we can create an entry point into our application. This will give us a Spring context to start building out our RESTful endpoints from.
package com.opsian.proglang;

import org.springframework.boot.SpringApplication;
import org.springframework.boot.autoconfigure.SpringBootApplication;

@SpringBootApplication
public class ProgLangApplication {

    public static void main(String[] args) {
        SpringApplication.run(ProgLangApplication.class);
    }
}
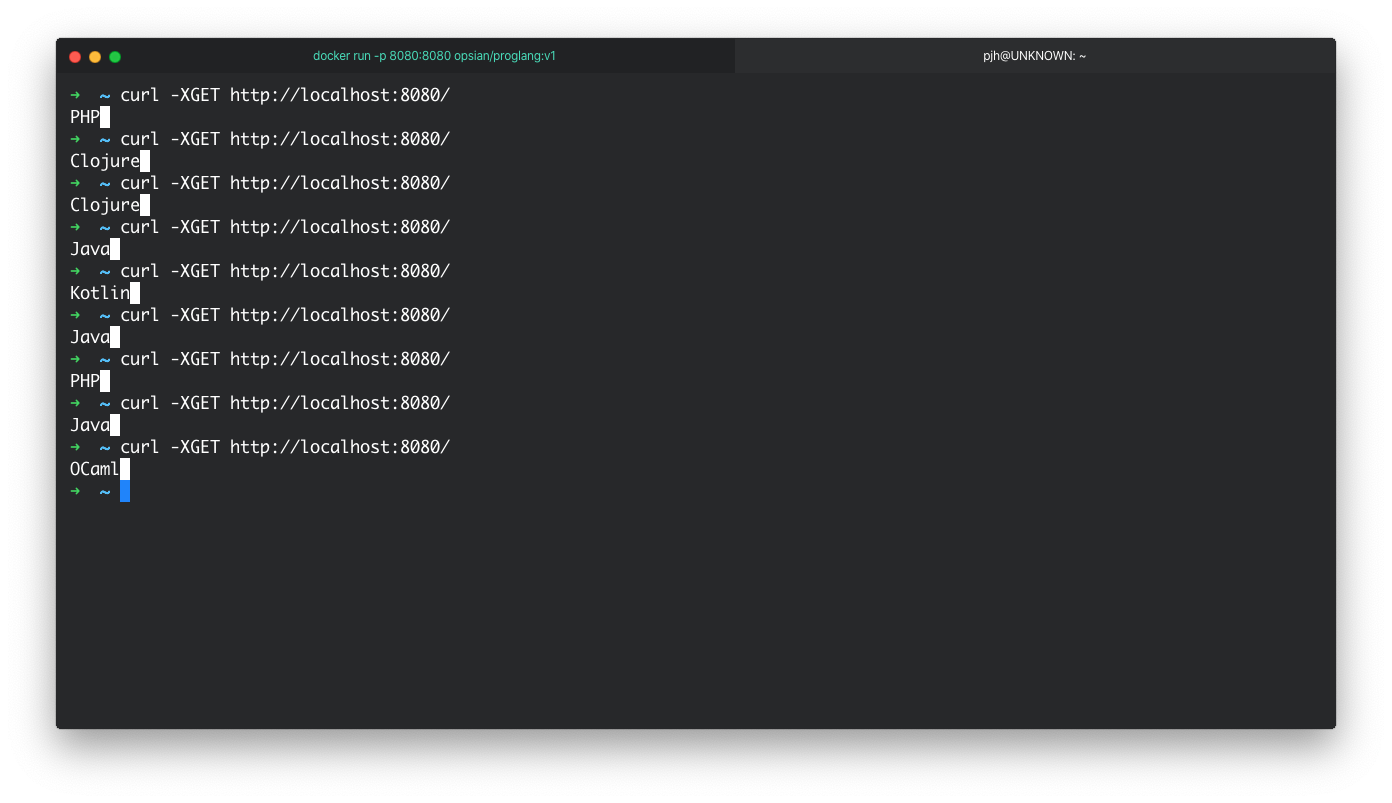
We are now in a position to write the functionality of our process and allow clients to contect to our application from a synchronous HTTP GET request. Here, a Random() class is created along with a generic type List<String> containing programming language names. Everytime the endpoint is requested a new programming language should be returned.
package com.opsian.proglang;

import org.springframework.web.bind.annotation.GetMapping;
import org.springframework.web.bind.annotation.RestController;

import java.util.Arrays;
import java.util.List;
import java.util.Random;

@RestController
public class ProgLangController {
    final private List<String> progLangs = Arrays.asList(
        "Java",
        "Scala",
        "Kotlin",
        "Eta",
        "Clojure",
        "Groovy",
        "Go",
        "OCaml",
        "PHP"
  );

    @GetMapping("/")
    public String indexRoute() {
        int idx = ThreadLocalRandom.current().nextInt(progLangs.size());
        return progLangs.get(idx);
    }
}
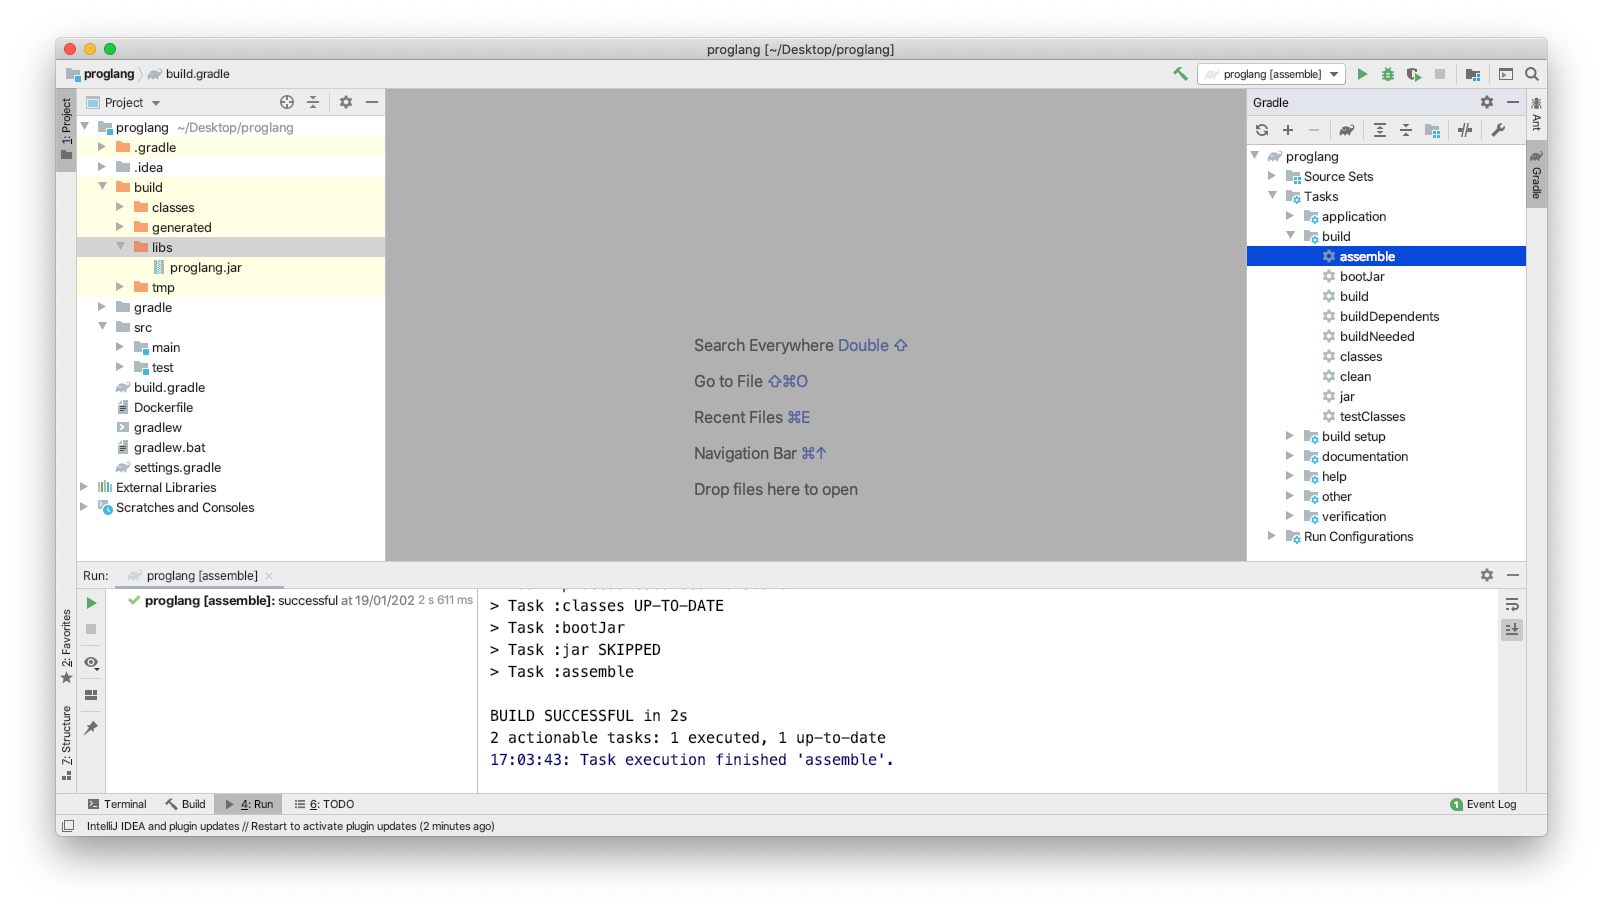
The gradle:assemble task can be used to create an uber jar which will bundle our code and dependencies to create a bootable executable. We can now run java -jar proglang.jar from the command line to start our application.
Containerizing with Docker
Now a basic application has been created we can containerize it. Dockerizing a Java Application is a rather simple process. Before trying to build an image you should make sure Docker is installed on your host. Building docker containers requires us to create an image which our containers will be built off.
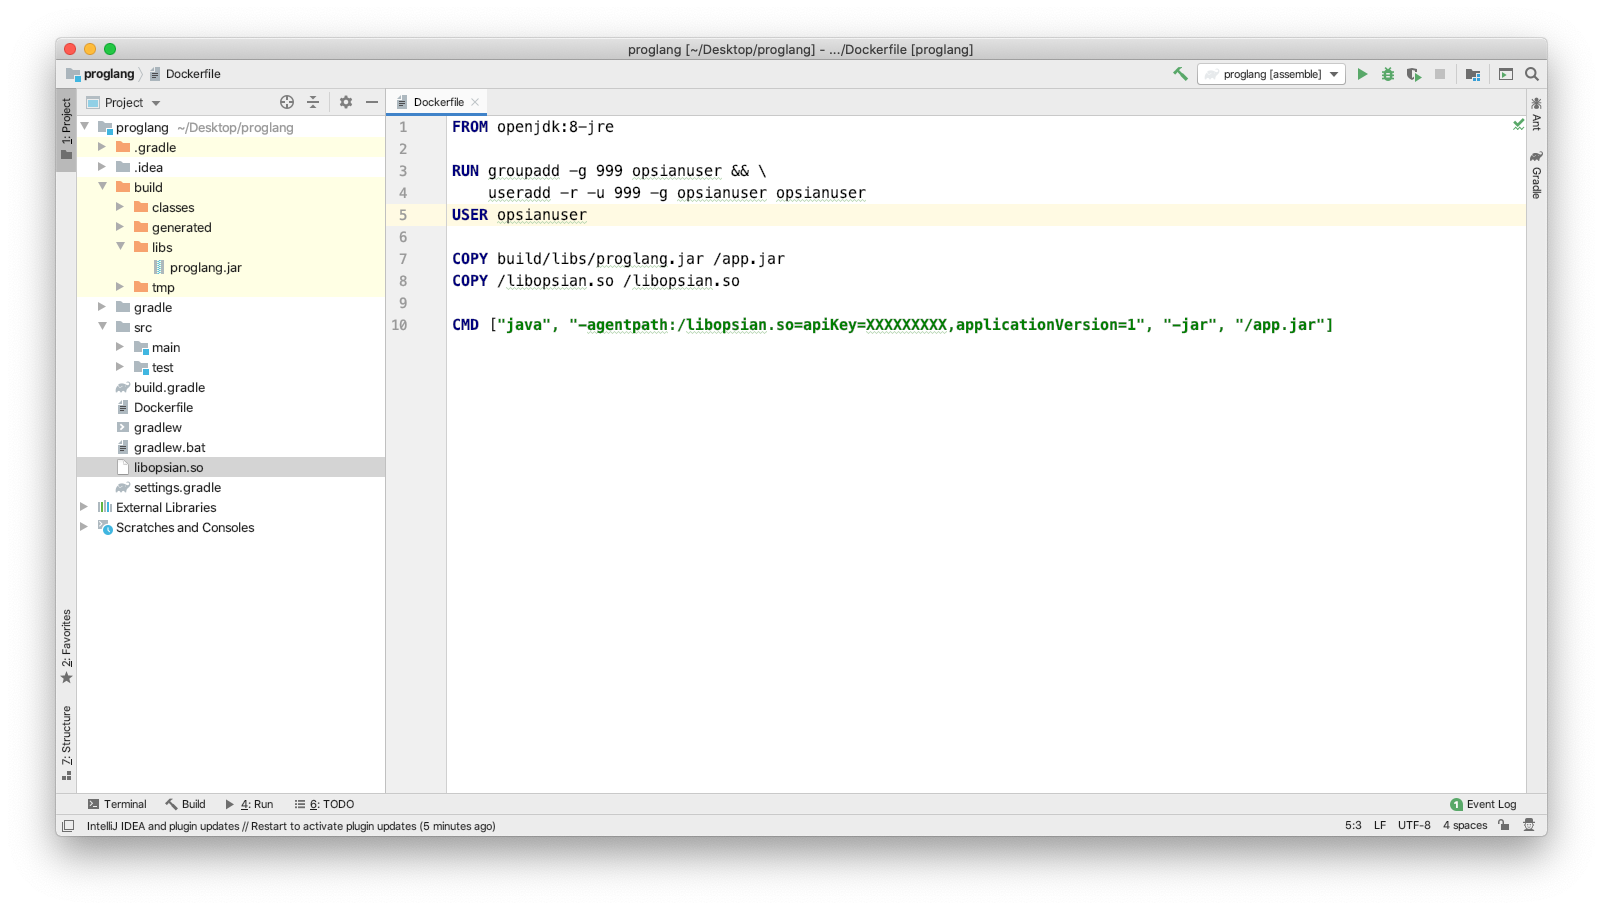
Depending on your build tool you can use numerous plugins to help build your docker container. For example, Fabic8 for Maven or gradle-docker for Gradle. Below, which is my preferred approach, is to keep the Dockerfile simple and in the root directory. This decouples it from the build tool and for this post, introduces the reader to Dockerfile syntax.
FROM openjdk:8-jre

RUN groupadd -g 999 opsianuser && \
    useradd -r -u 999 -g opsianuser opsianuser
USER opsianuser

COPY build/libs/proglang.jar /app.jar
COPY /libopsian.so /libopsian.so

CMD ["java", "-agentpath:/libopsian.so=apiKey=${OPSIAN_SECRET},applicationVersion=1", "-jar", "/app.jar"]
It's worth taking a couple of minutes to study the Dockerfile. The first line specifies the base image which we will deploy our application onto. As the jar we built via the gradle:assemble command in the last section requires a JRE to run we need to install an OS with a JRE installed. The openjdk:8-jre is a amd64 Linux distribution which ships with a Java 8 JRE - more information on the base image can be seen in DockerHub. The next 2 lines add a user to the containers images environment so it is not run as root. This is considered a good practice in the Docker community. The next 2 lines which begin with COPY move the resources from our local machine to the container. We move our generated proglang.jar built with gradle into / in the containers OS and rename it app.jar for simplicity. The final line, the line starting with CMD, executes our process when we create a container from our image and start it. The above Dockerfile assumes that the libopsian binary and assembled jar in the root of the codebase and you have changed OPSIAN_SECRET to your opsian API key. It can be built with the following command:
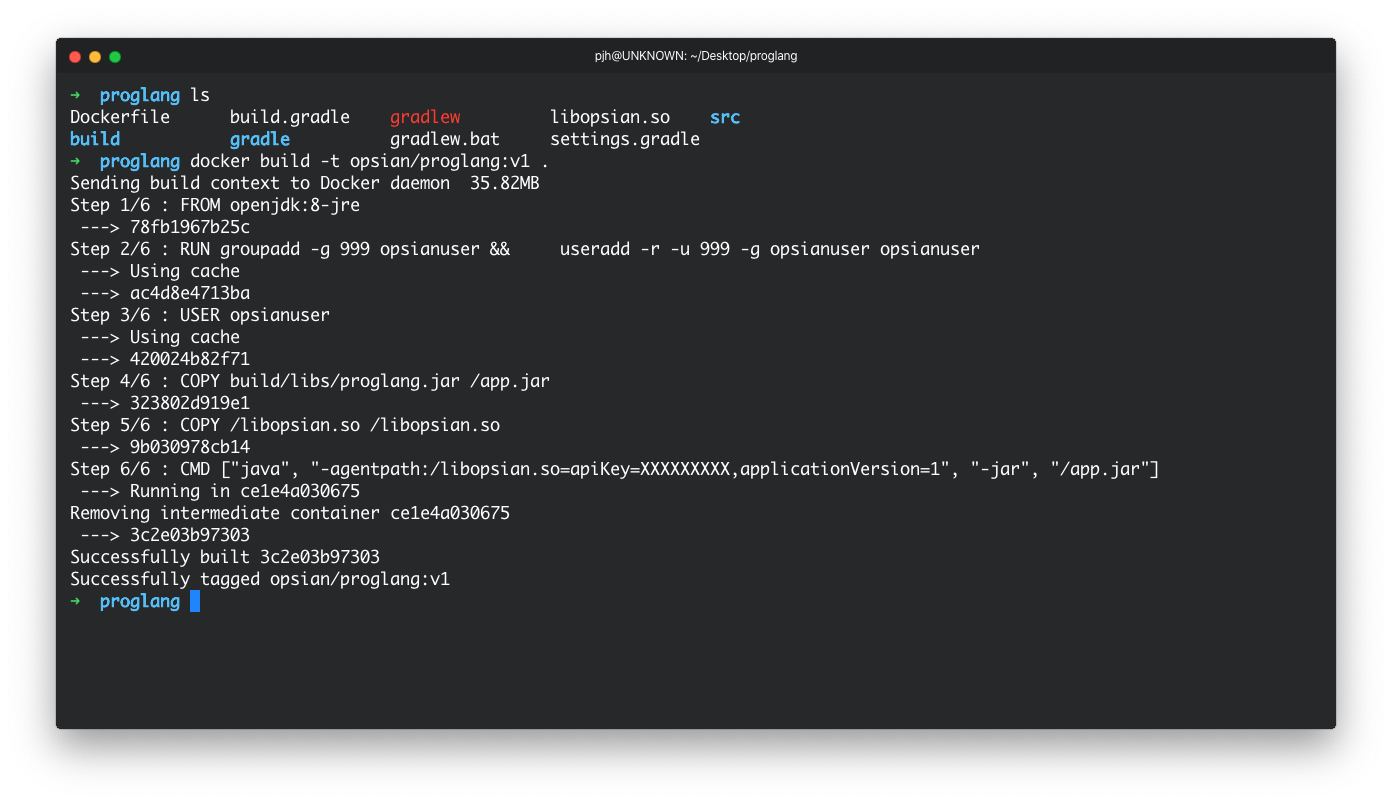
docker build -t opsian/proglang:v1 .
Once the image has been successfully created we can start the container with:
docker run -it -p 8080:8080 opsian/proglang:v1
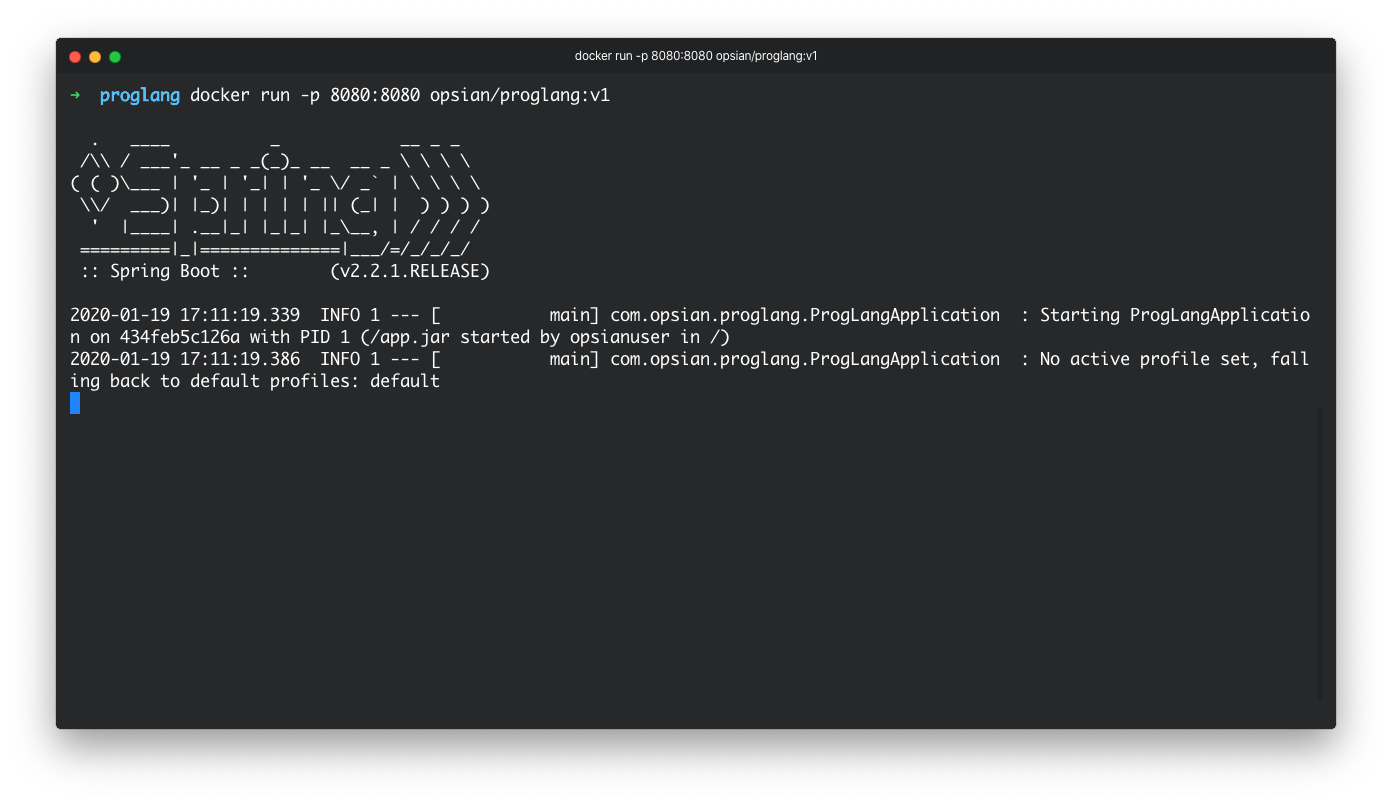
Now that the application process is exposed via the port 8080 we can use our command line or another application such as a browser to interact with the app.
Being able to run our containers off our Docker host is great and it entirely possible to run on on public cloud environments such as AWS EC2 without an orcahastrator. However, Kubernetes is becoming a defacto runtime platform for containers as it offers a lot of useful features, especially if you are running more than 1 container. In the next session of this post we will look at deploying our container to MiniKube - a local simulation of a Kubernetes cluster.
Kubernetes Deployment
Before proceeding it is worth questioning, what is Kubernetes, and what is it going to do for me? Kubernetes, simply put, is like an operating system for containers. It provides features such as load balancing, service detection, resource management, secret management and more. As this post is focused on getting Opsian to work on a container running on Kubernetes we won't be creating a multi-service deployment, instead focusing on the service that was built out in the previous section.
In this post we use Minikube as our Kubernetes cluster. The same concept applies if you are running in a public cloud such as GCP, Azure or AWS. Alternatively, if you planning to deploy to Red Hat's Openshift, you can download and deploy to Minishift instead.
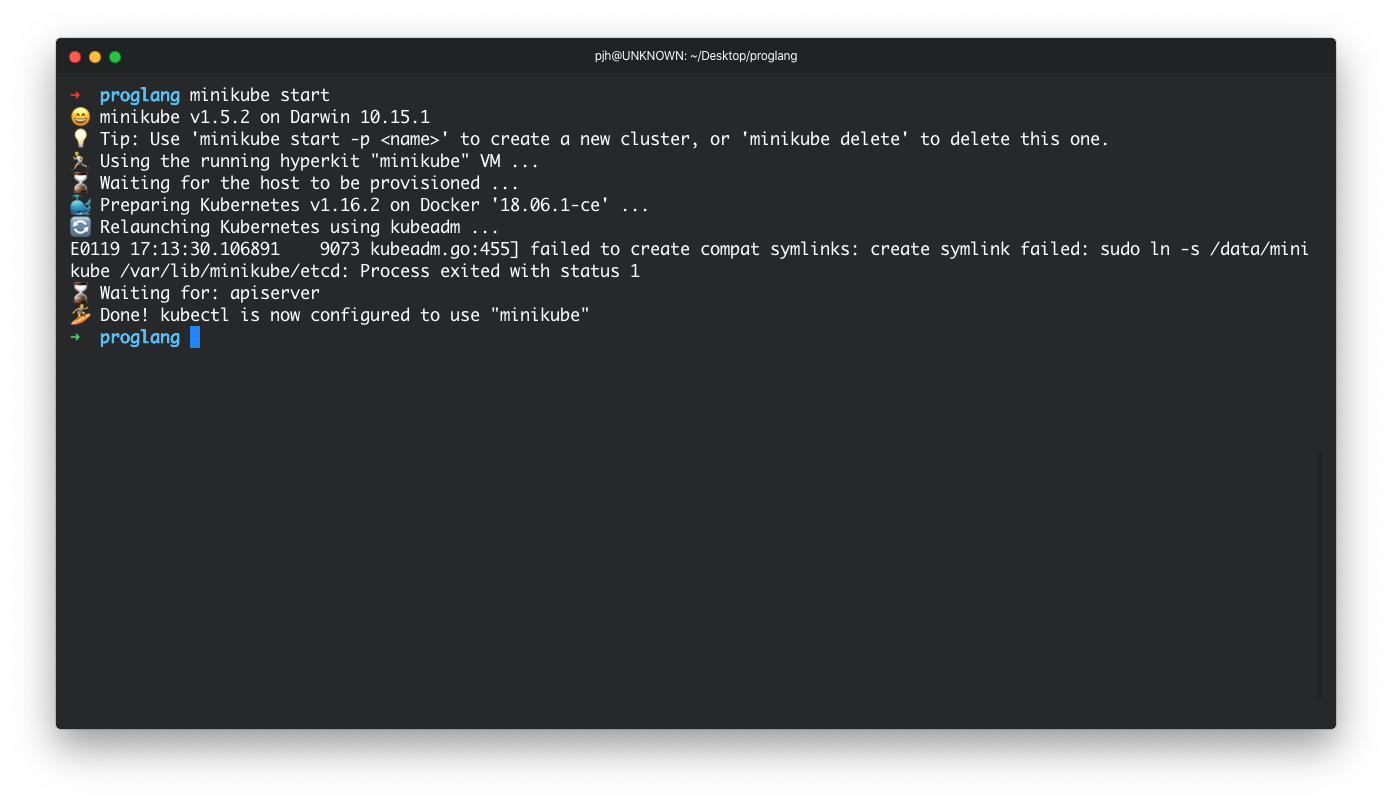
Once Minikube is installed we need to start the cluster. This can be achieved with the start command.
$ minikube start
Once this has been done we can view the Kubernetes dashboard by using the command:
$ minikube dashboard
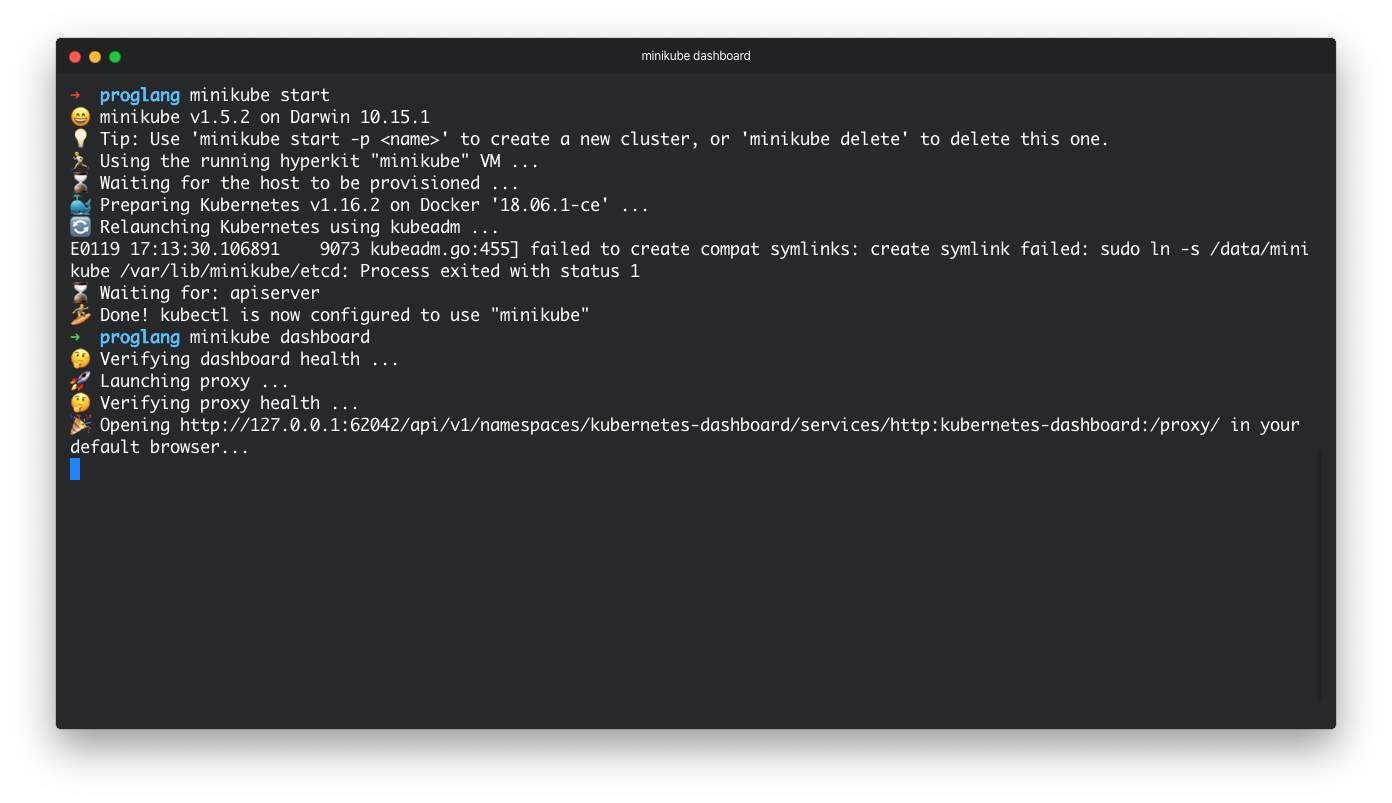
Once that command has been run we should be returned a URL which should look like the below:
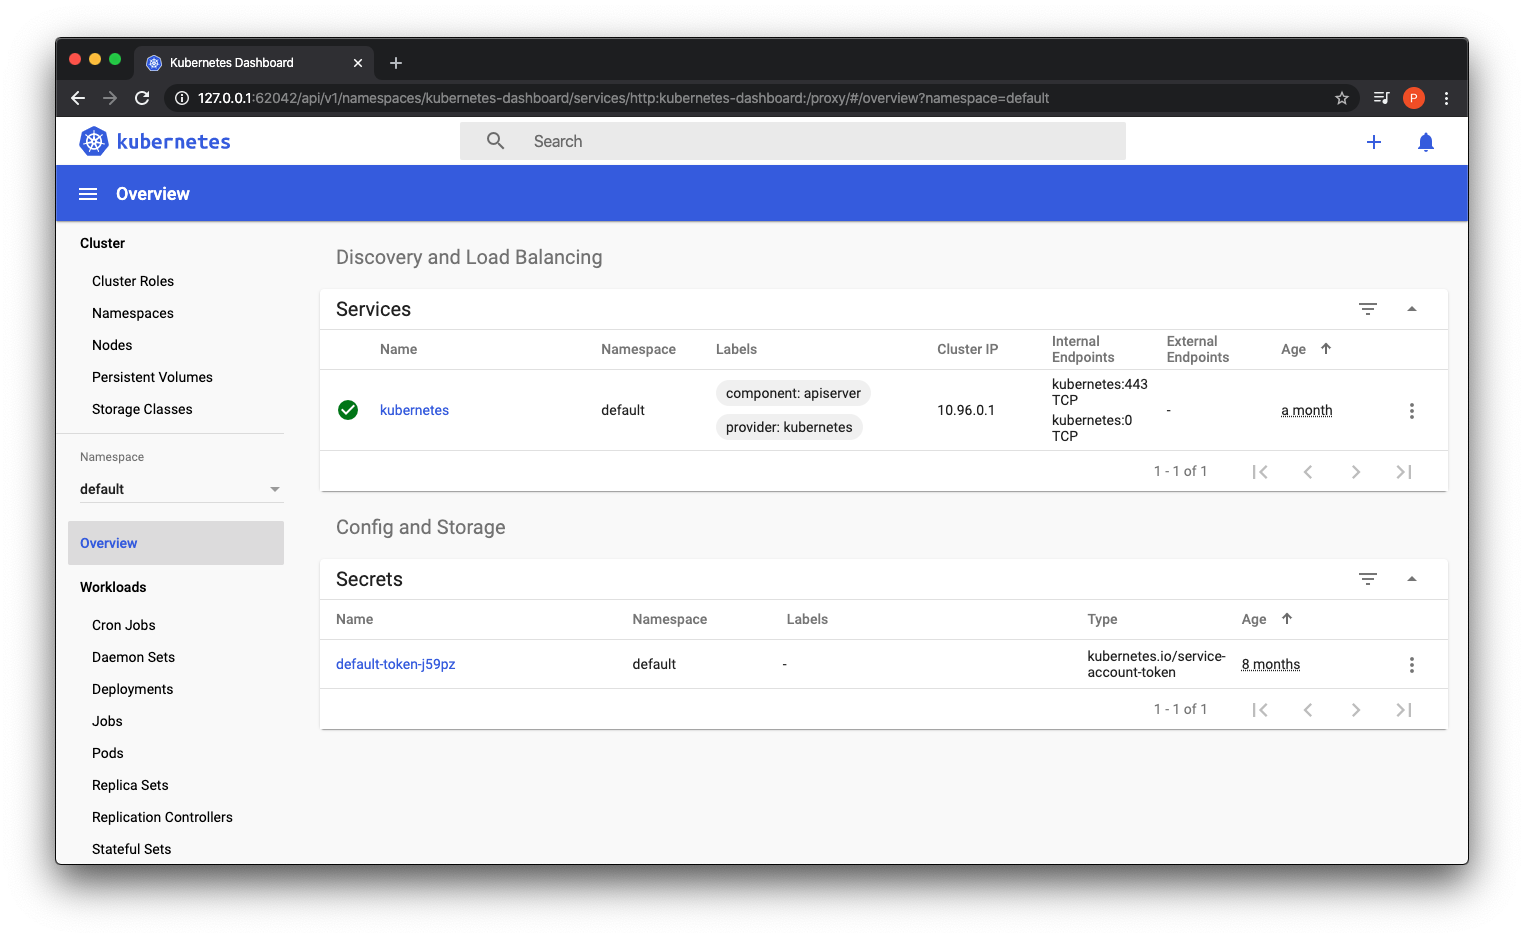
This is a great place to be. Now we are in a position to create a deployment. A Kubernetes deployment is like a blueprint for how you want your containers to be run from an image. To interact with our cluster we will now have to use the kubectl tool which is used for interacting with the cluster. Typically the deployment files are crafted by the developer and deployed out, but we can simplify this for demonstration purposes with the create deployment commands.
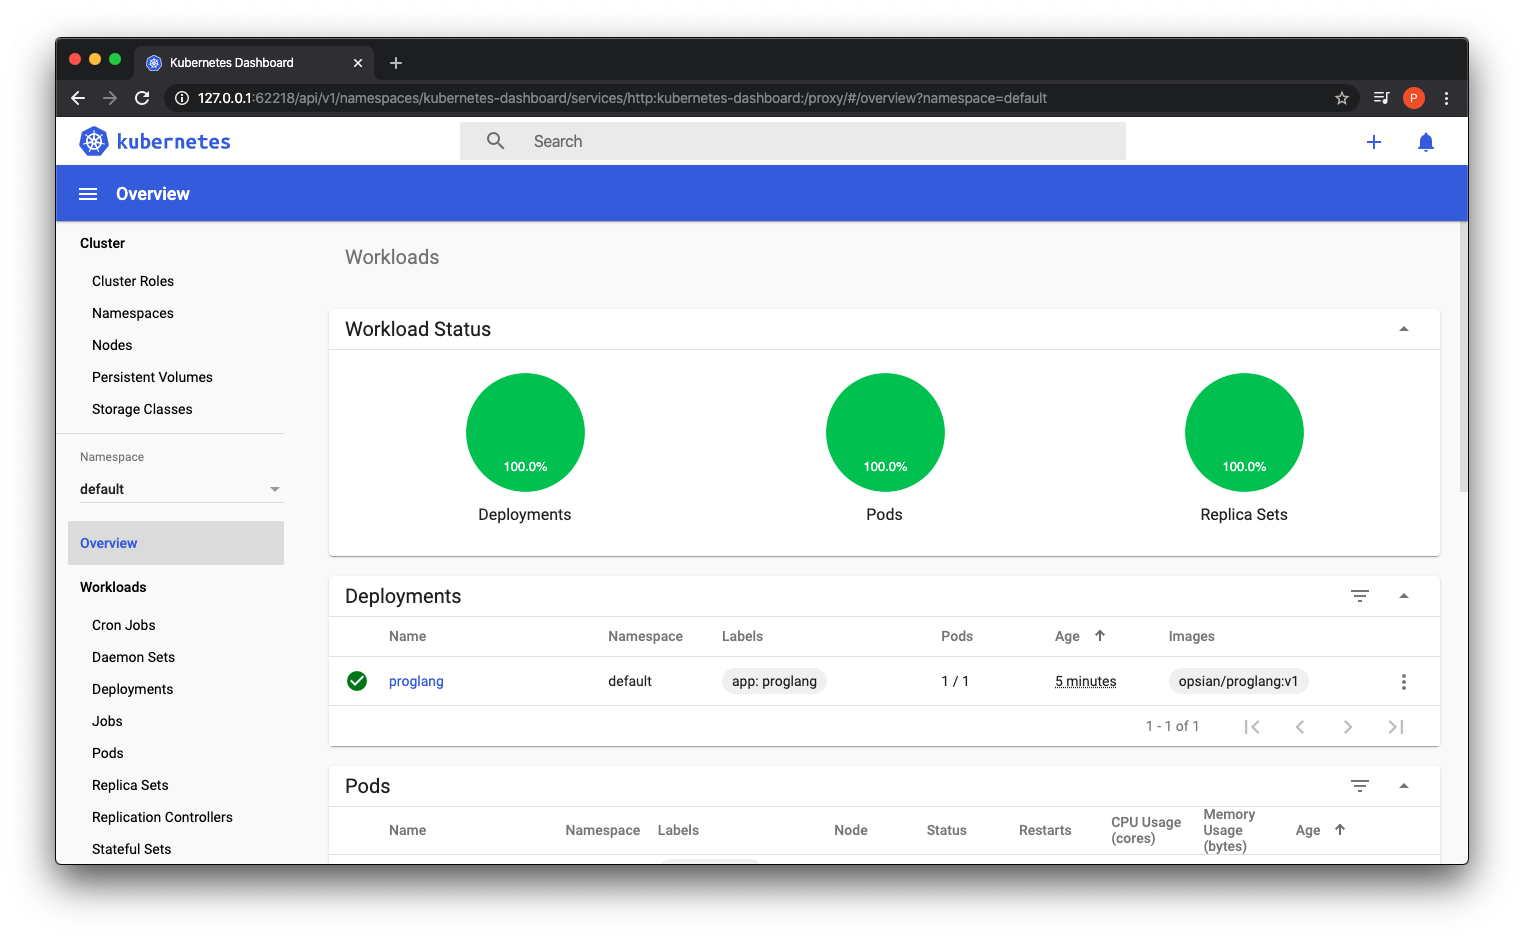
$ kubectl create deployment proglang --image=opsian/proglang:v1
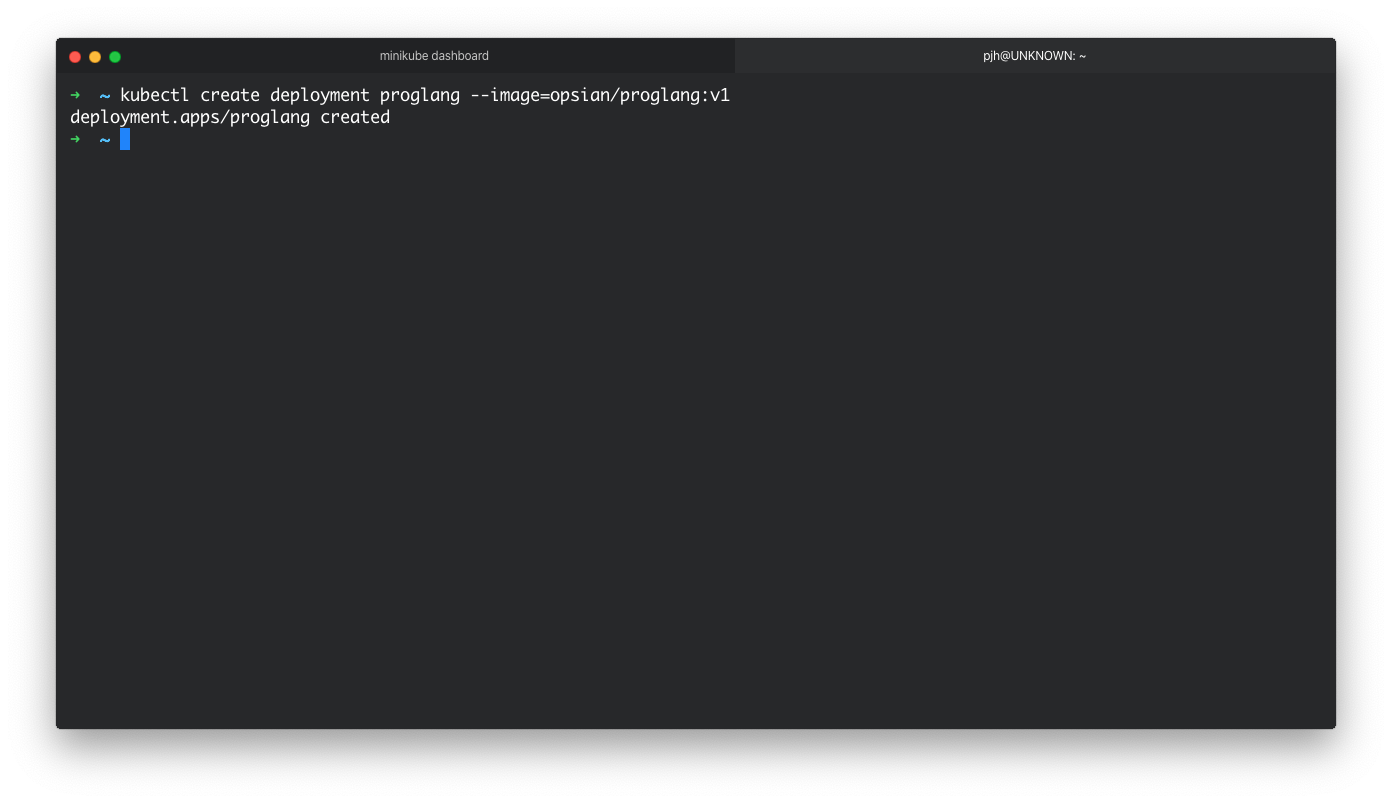
The terminal should say that the deployment has been successfully created, and now if we view our dashboard we should see our container running with 1 replica.
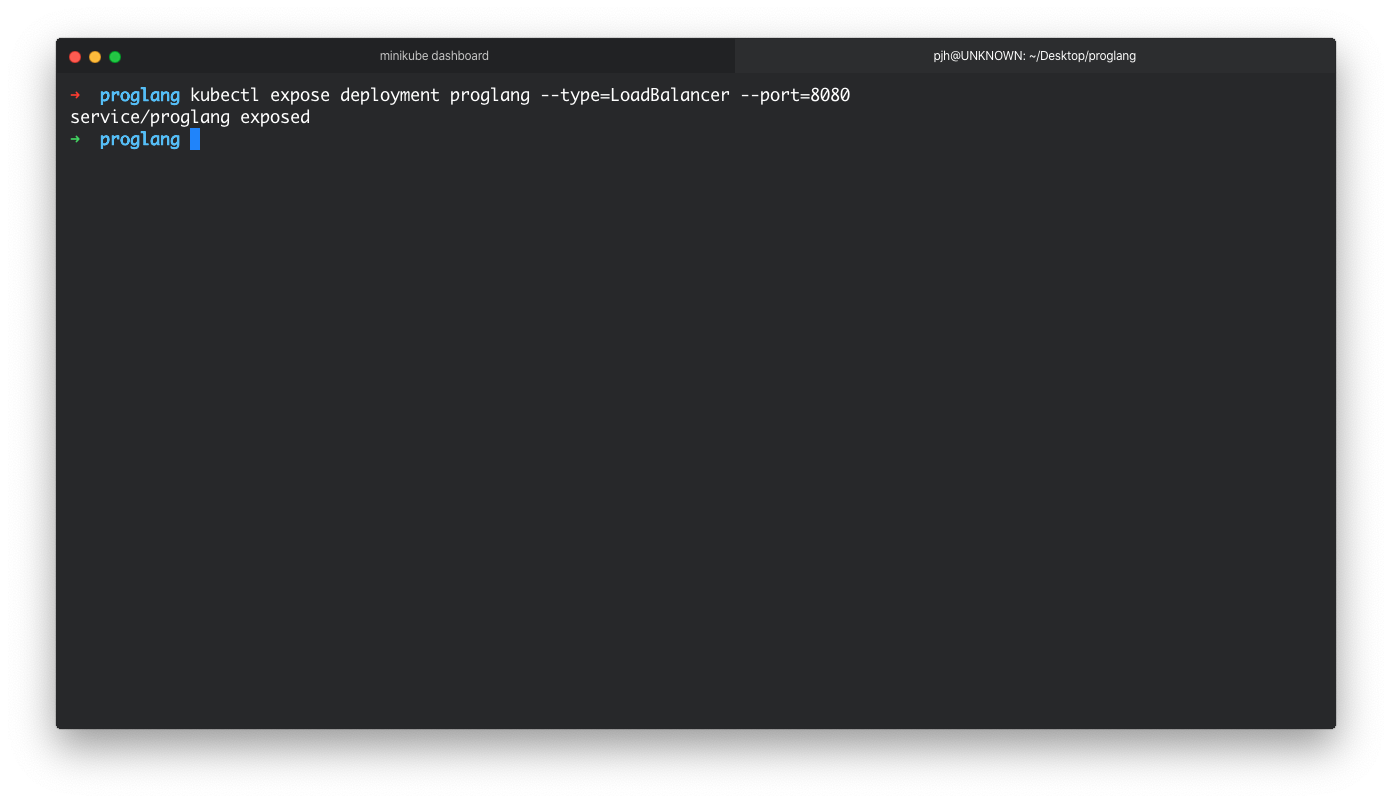
You may have noticed at this point if you visted http://localhost:8080/ that the application is not running. This is because that although it is running within the cluster it is not exposed to the outside world. The Kubernetes documentation states that services are a way to expose your pods to consumers outside the cluster. This can be achieved with the expose deployment command like so:
$ kubectl expose deployment proglang --type=LoadBalancer --port=8080
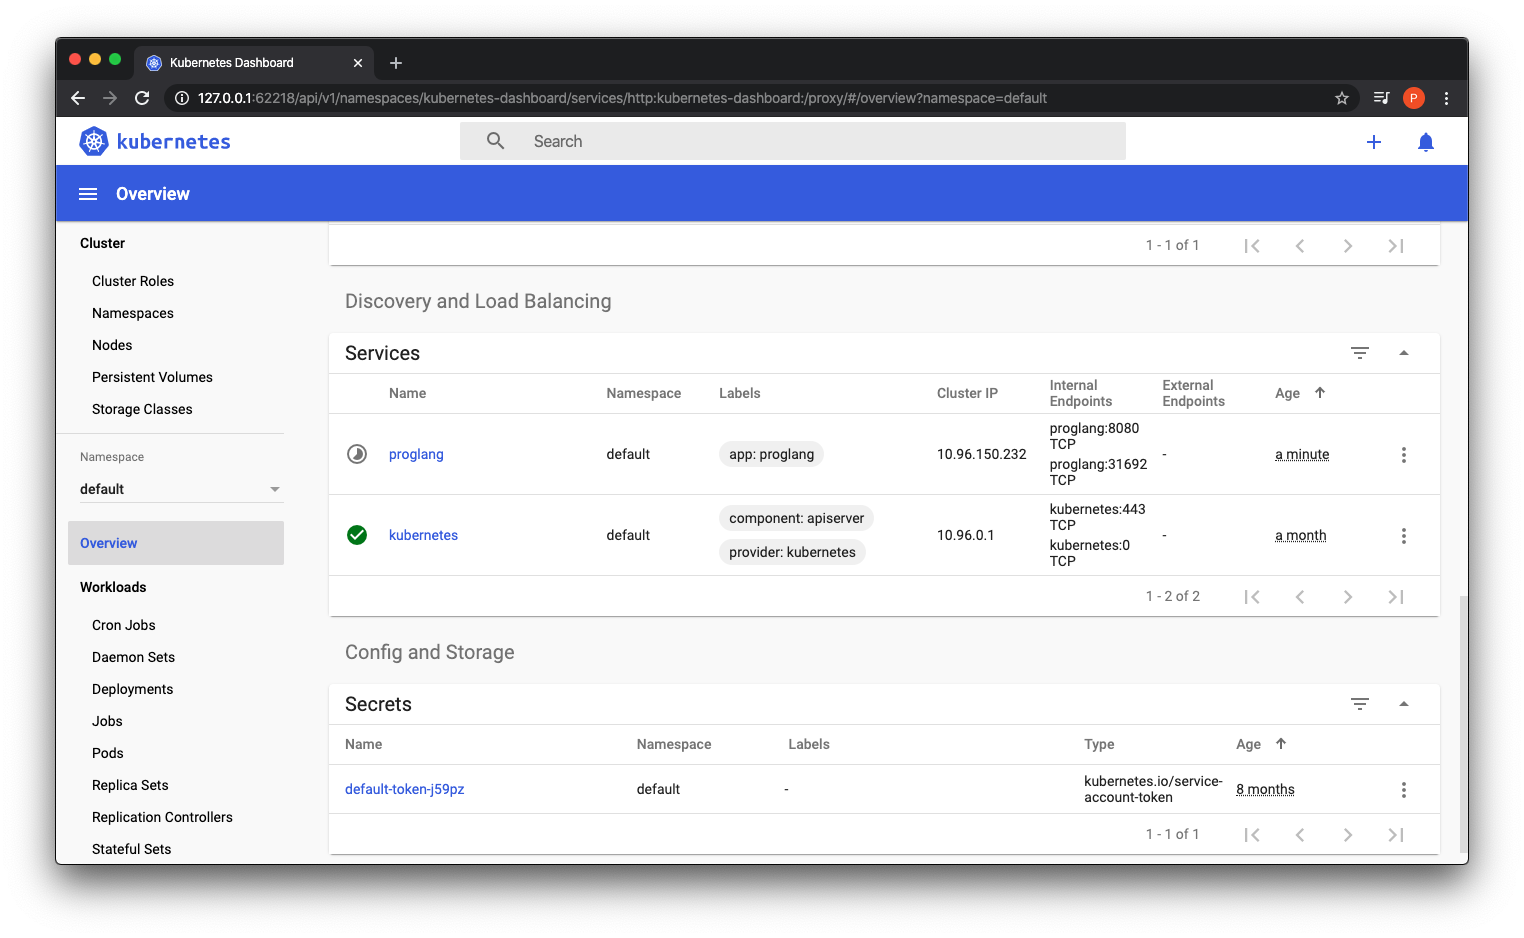
We should be able to see that the service has been created in our dashboard. But if you try to view the service in a web browser at http://localhost:8080/ there will still be nothing there. This may lead you to think there is something wrong, but it is unlikely at this point if the deployment and service are showing as running in the dashboard.
The reason why is that it is not exposed on your localhost, it is still running in the emulated cluster on your machine. You can access the service using the minikube service command along with the deployment name.
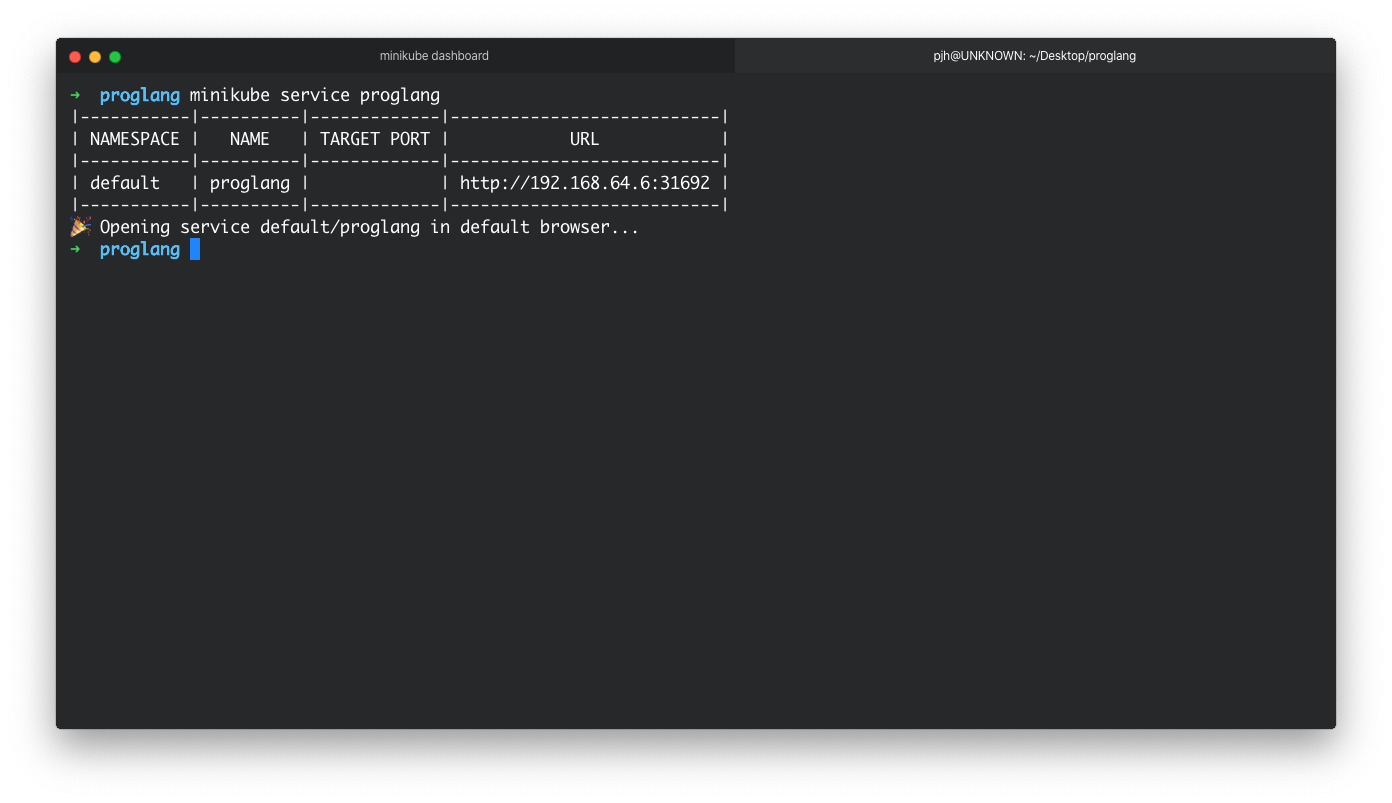
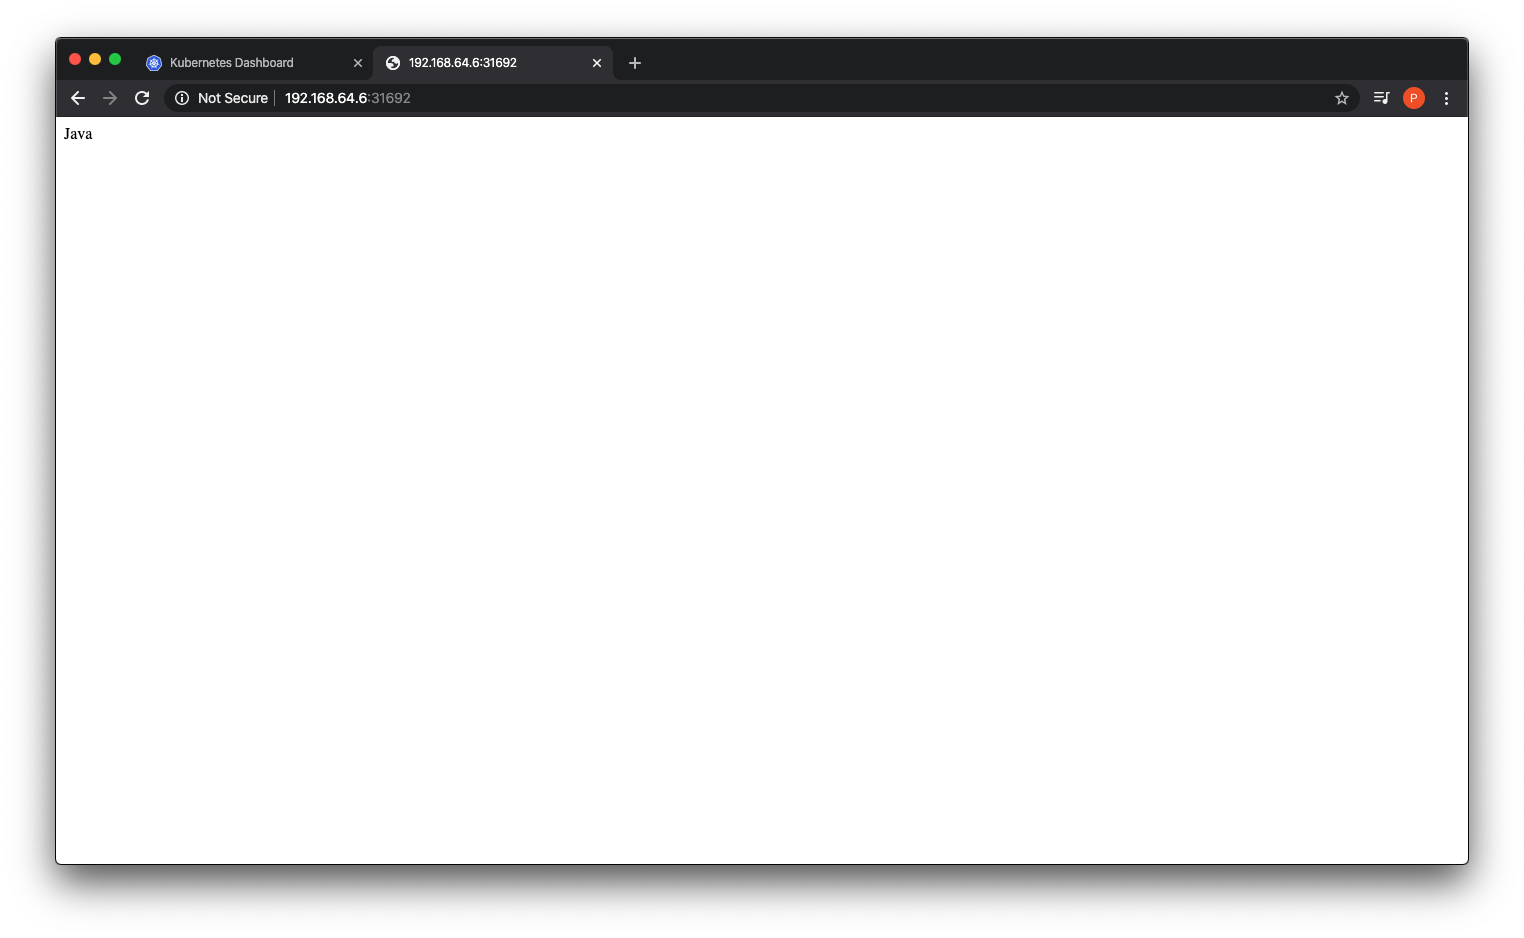
This should, if everything is working ok, open a browser window with your root endpoint showing.
In this section we looked at how to deploy a container to a Kubernetes cluster and expose it as a webservice to the outside world. In the next section we look at how Opsian interacts with our service and vice versa.
Opsian Dashboard
As we see, getting up and running with Docker and Kubernetes is relatively straight forward. The path to getting Opsian setup was also a relatively straight forward process as all we had to do was:
- Sign up for a free trial at https://www.opsian.com/
- Add the libopsian.so file to our project root
- Add the API key to our docker build
As we have deployed our application processes with the Opsian binary installed we can view our profiling data in Kubernetes.
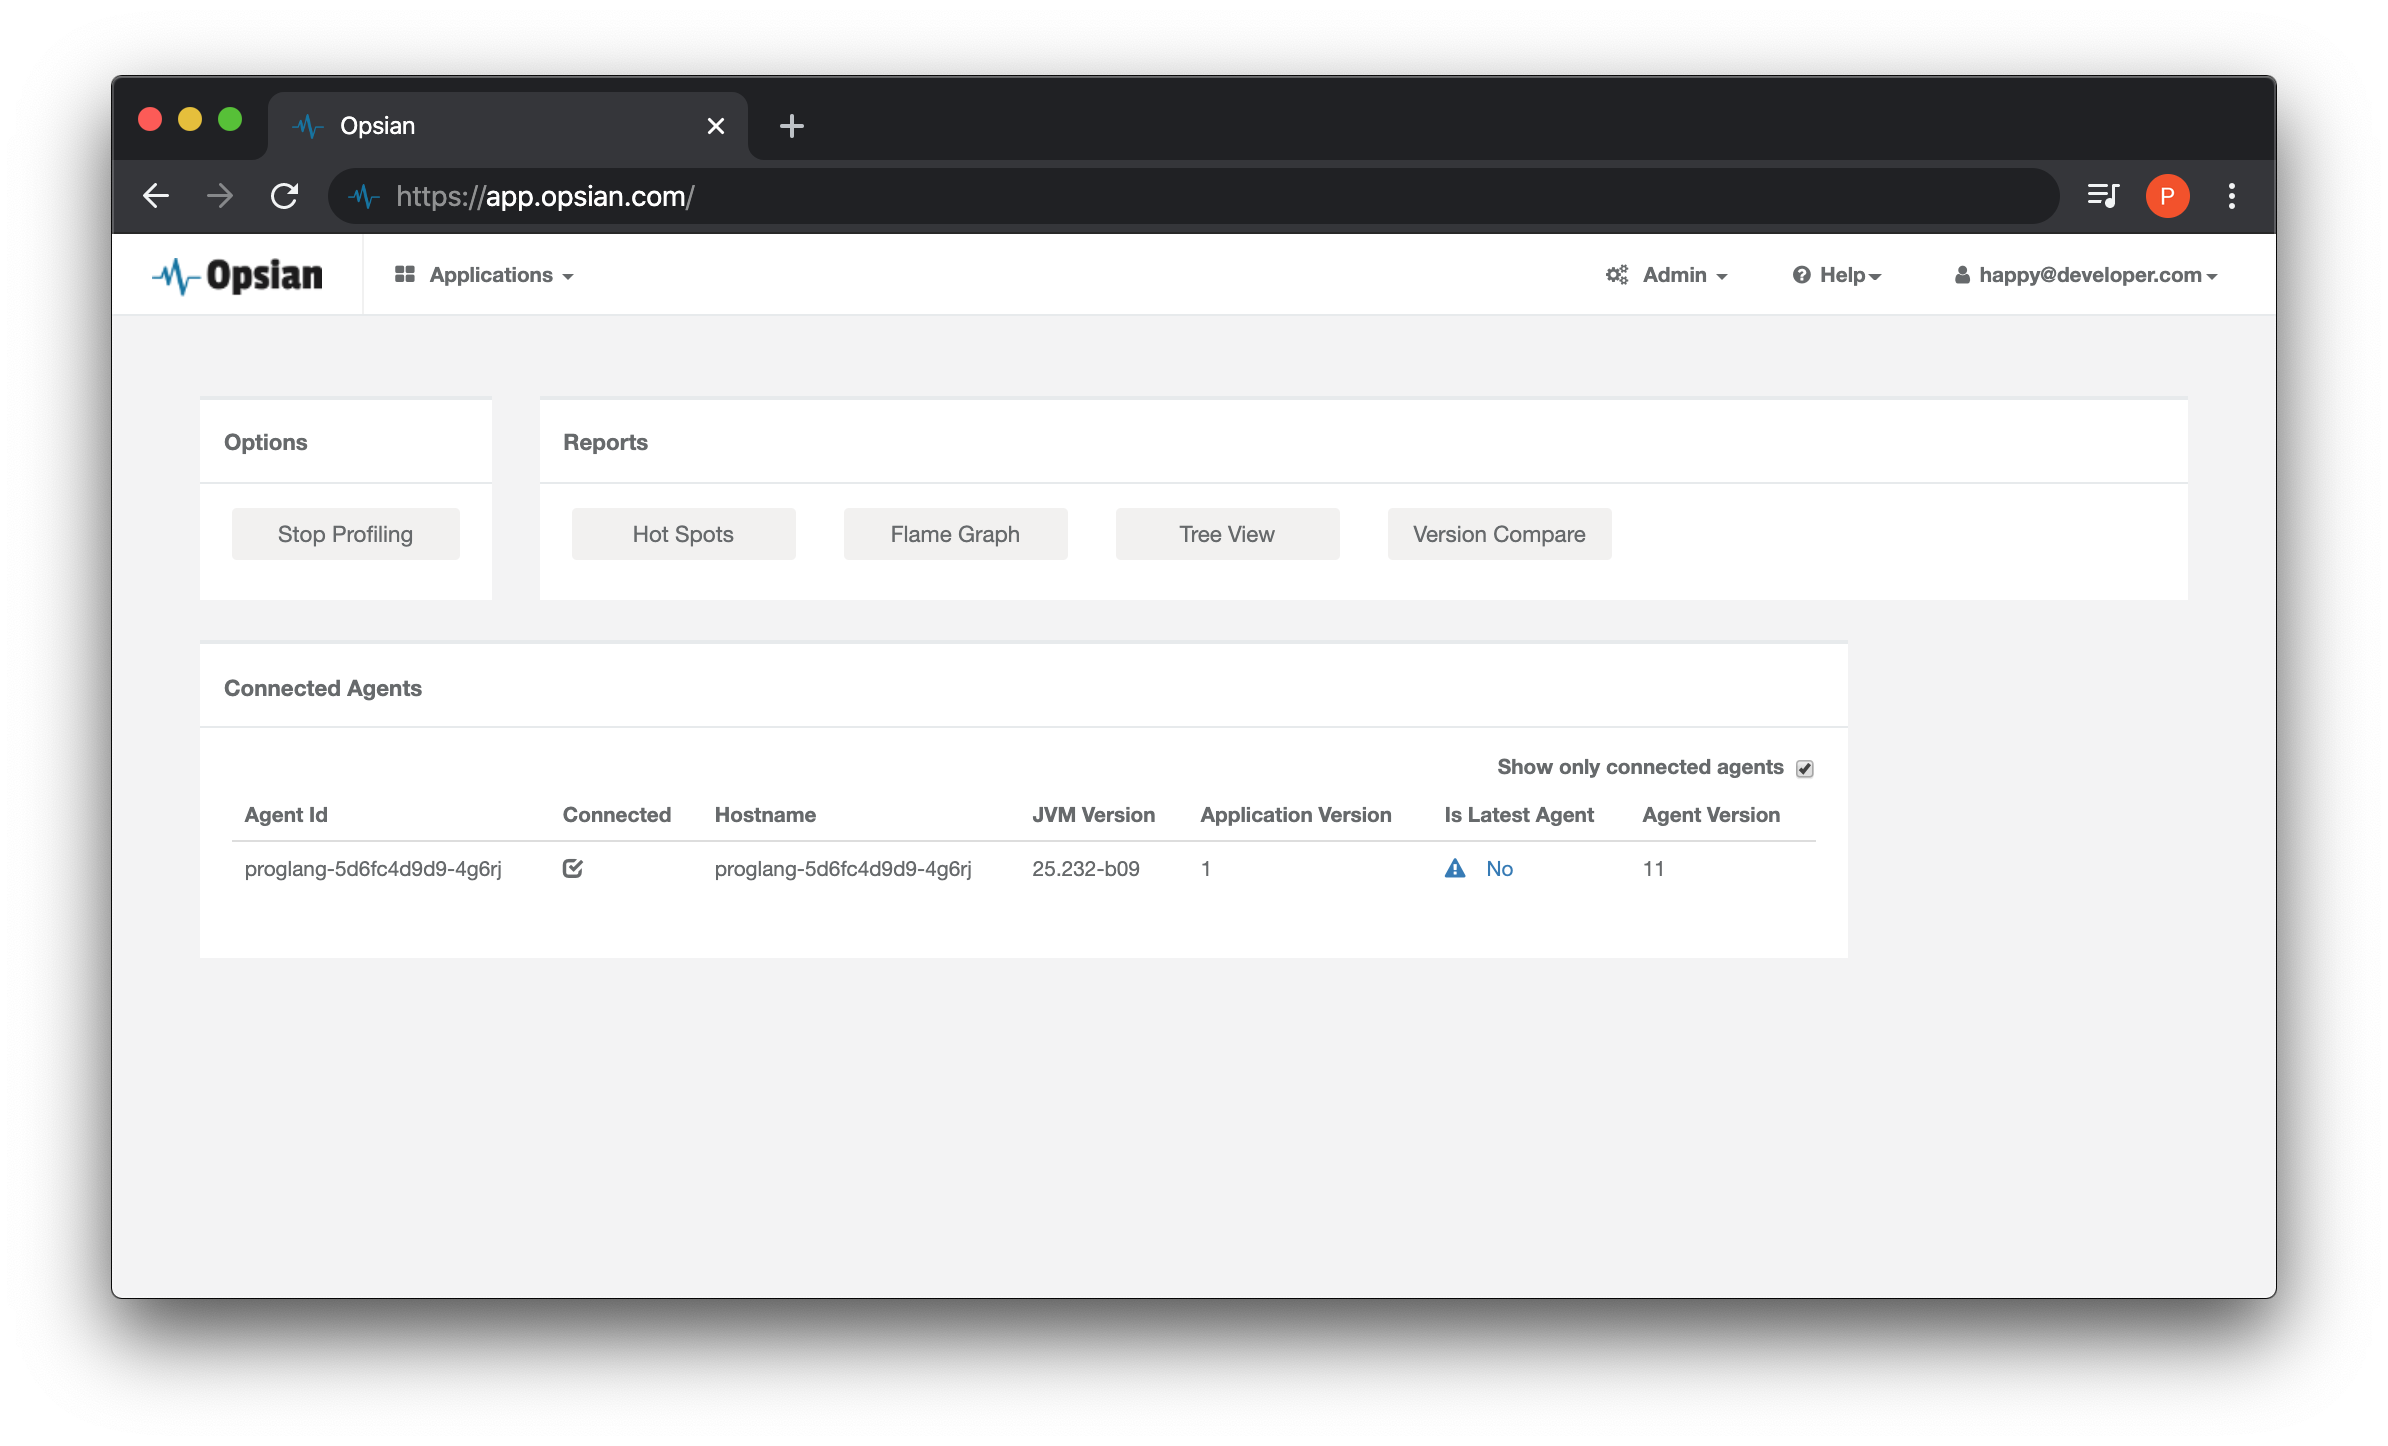
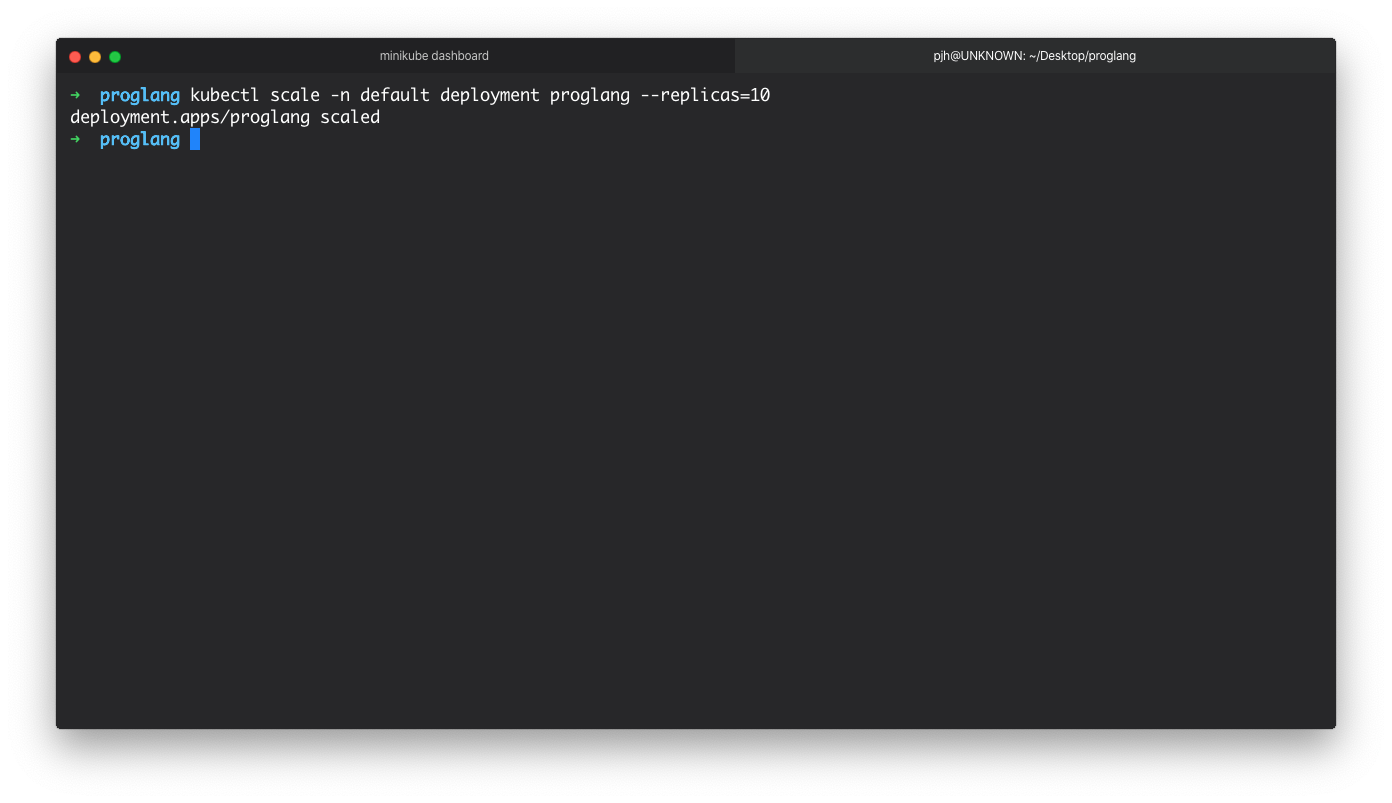
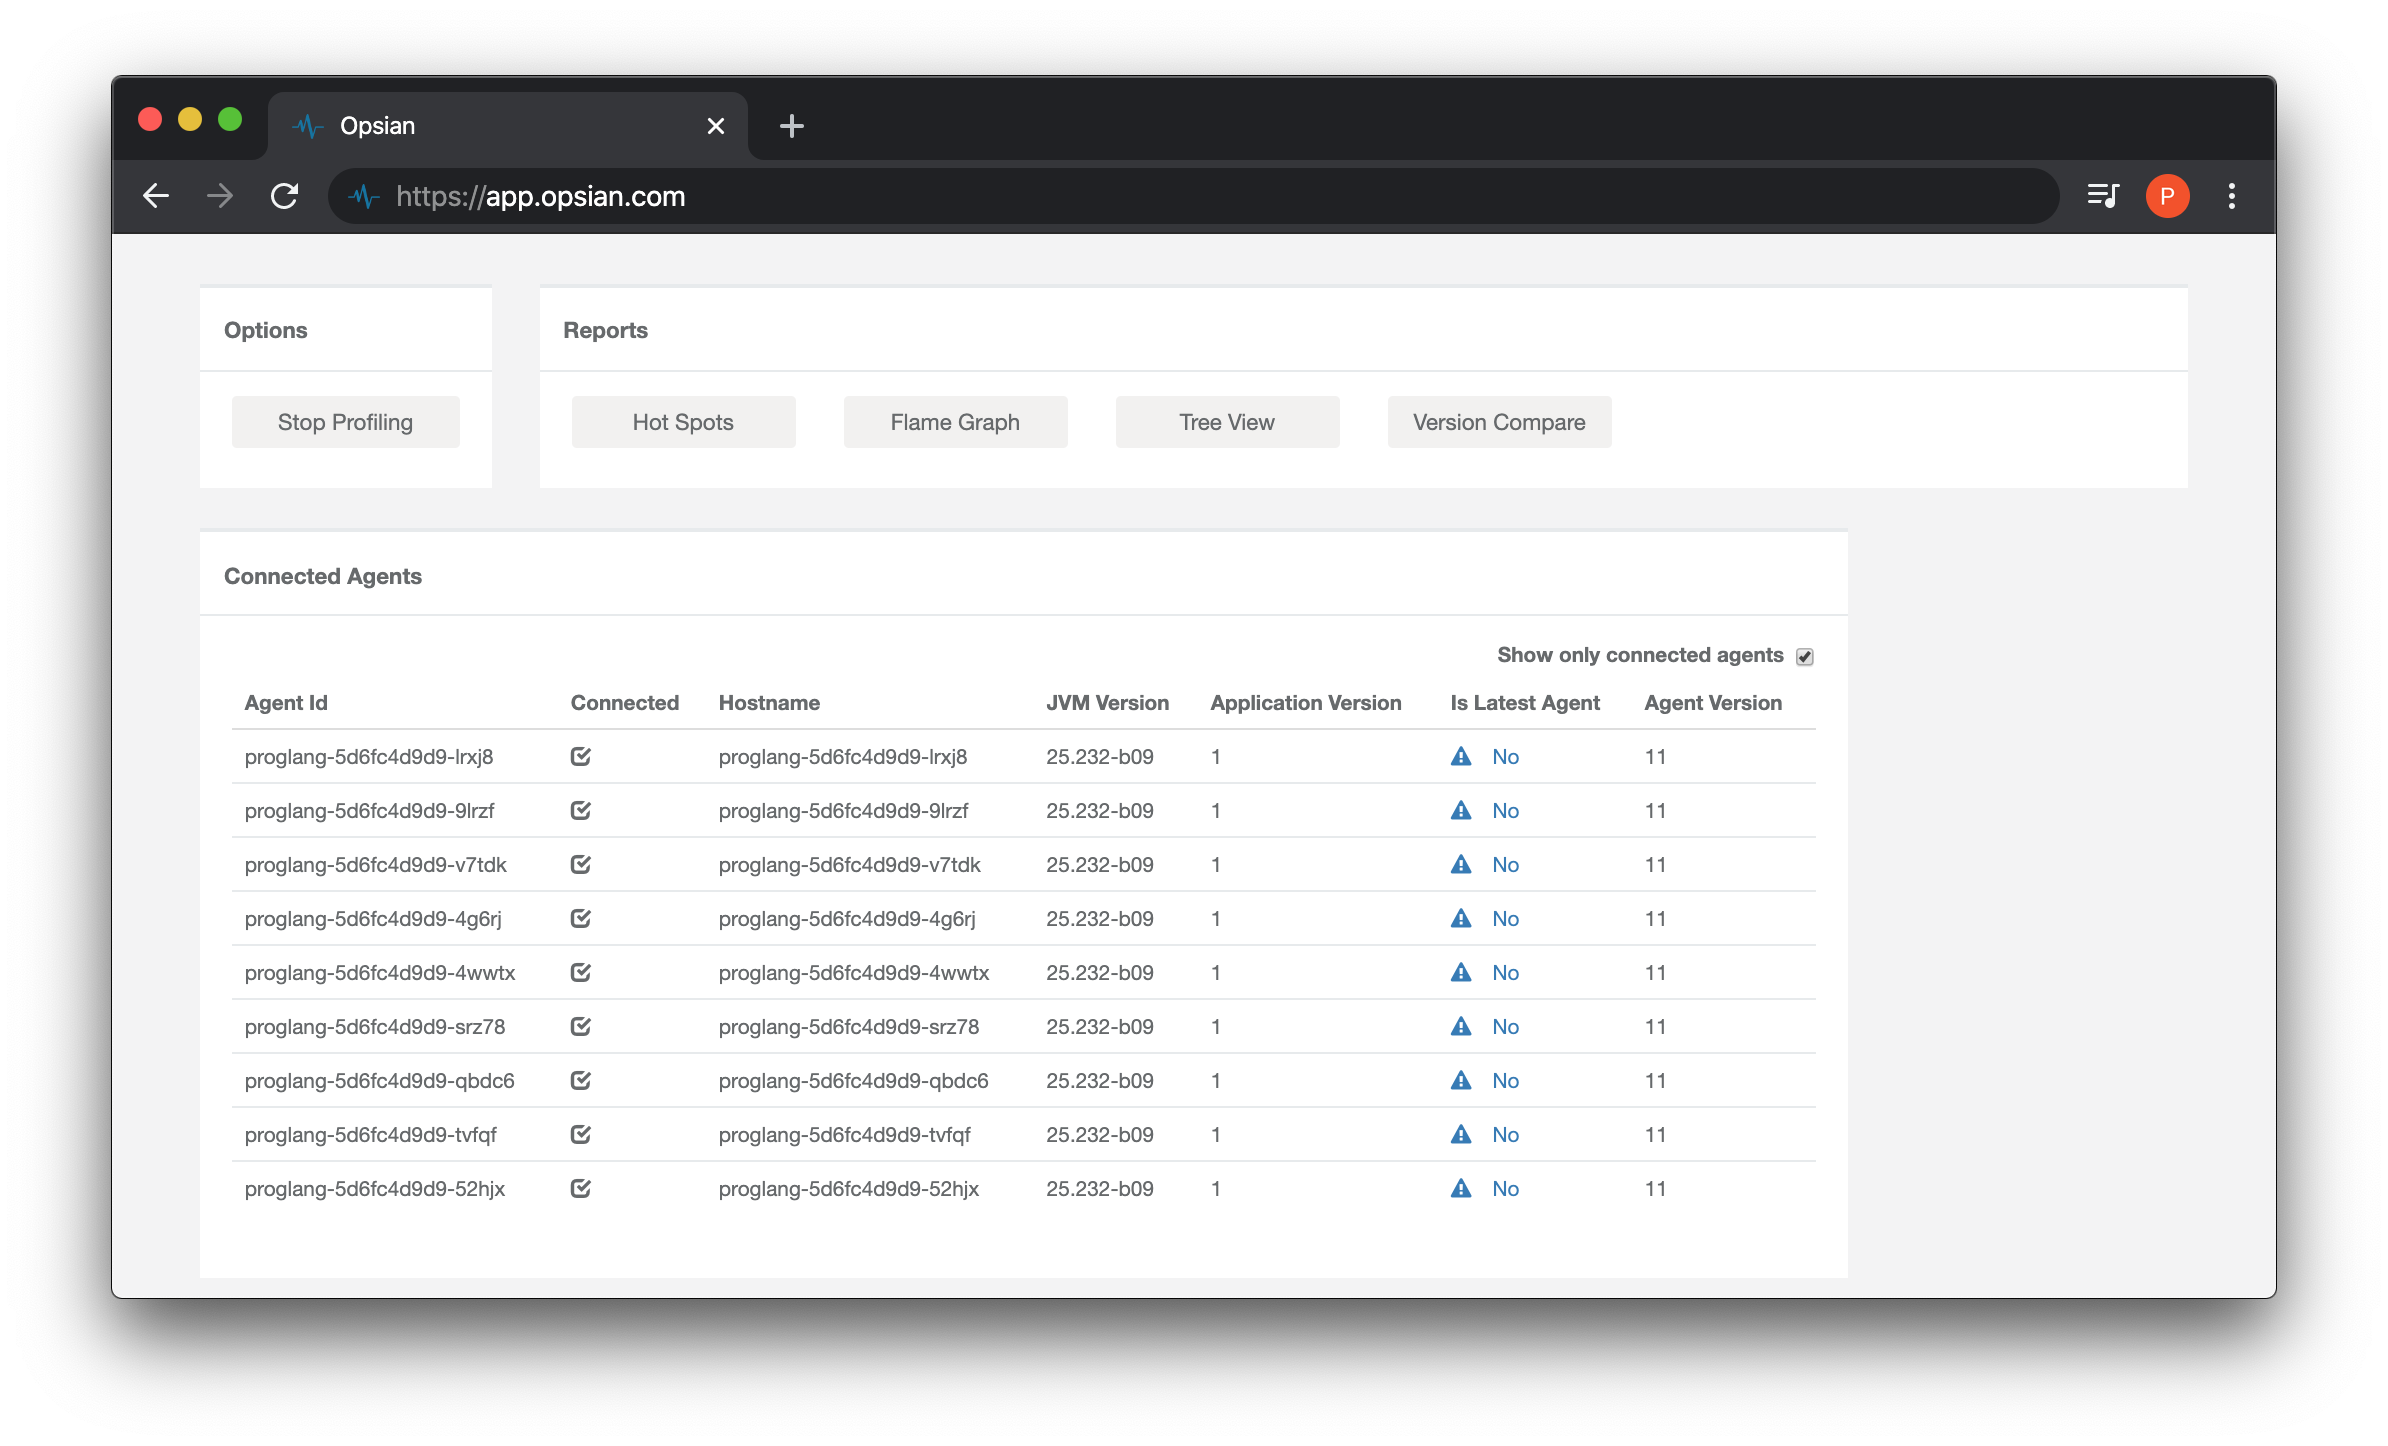
One common use case of using a orchastrator such as Kubernetes is to scale out compute horizontally when the application come under increased requests. This means increasing the number of pods to handle the workload that the external world demands of them. There are ways to do this automatically, but for the sake of demonstration you can use the scale -n command to scale the application.
The additional replicas should automatically show up on the Opsian dashboard. This is because each is running its own JVM and transmitting the profiling data to the Opsian servers. Opsian can generate reports aggregated over all instances of a particular application or restricted to a single instance. The latter is useful in trying to understand why one particular instance might be misbehaving, for example.
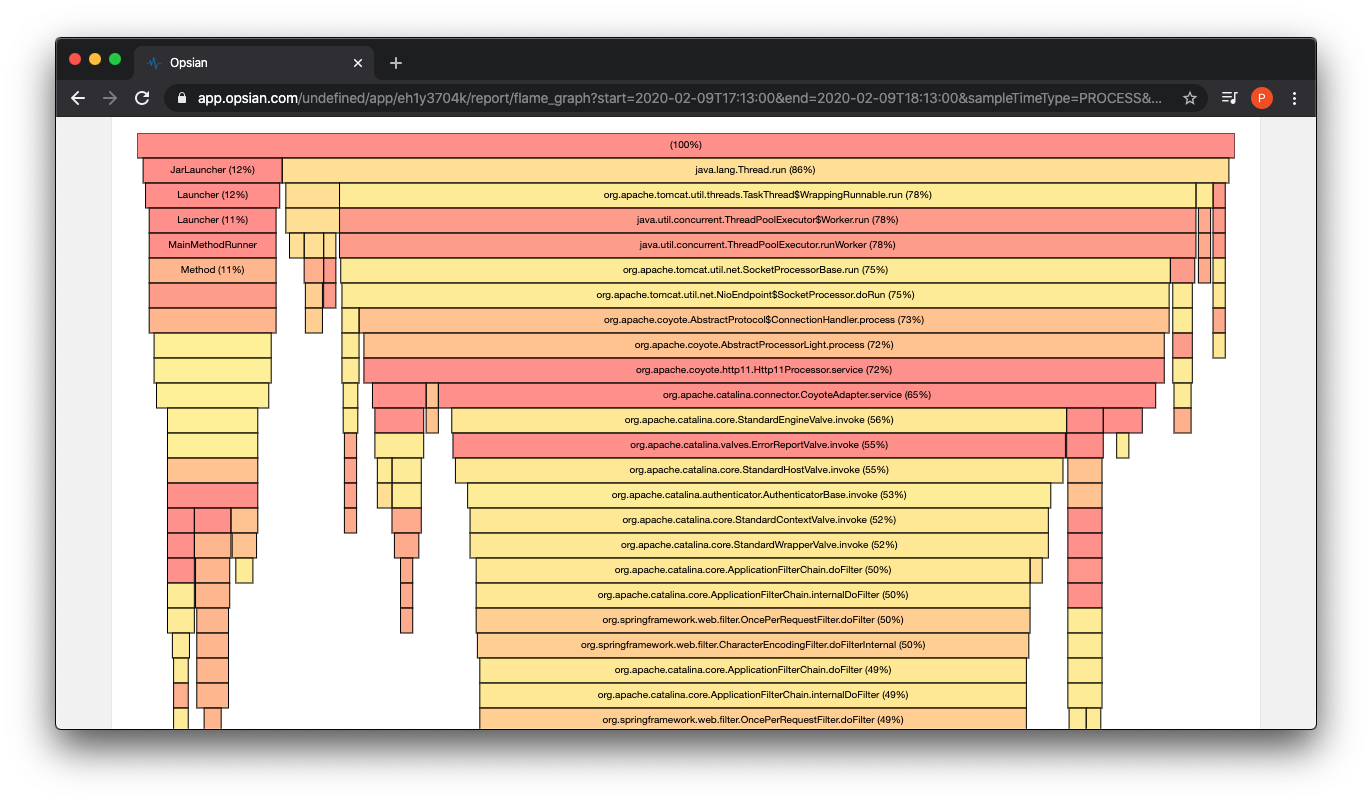
Now it's possible to inspect some Flame Graphs which where we can get detailed inspection of the time spent in the JVM. This is an interactive graph that can be clicked on to inspect frames in better detail and inspect hotspots. As this is a simple application the data being displayed in the following screenshots are to do with the classloader and the JVM starting. These are still worth studying though especially if there are lots of JARs on the classpath or the app starts with app specific tasks such as loading state into memory.
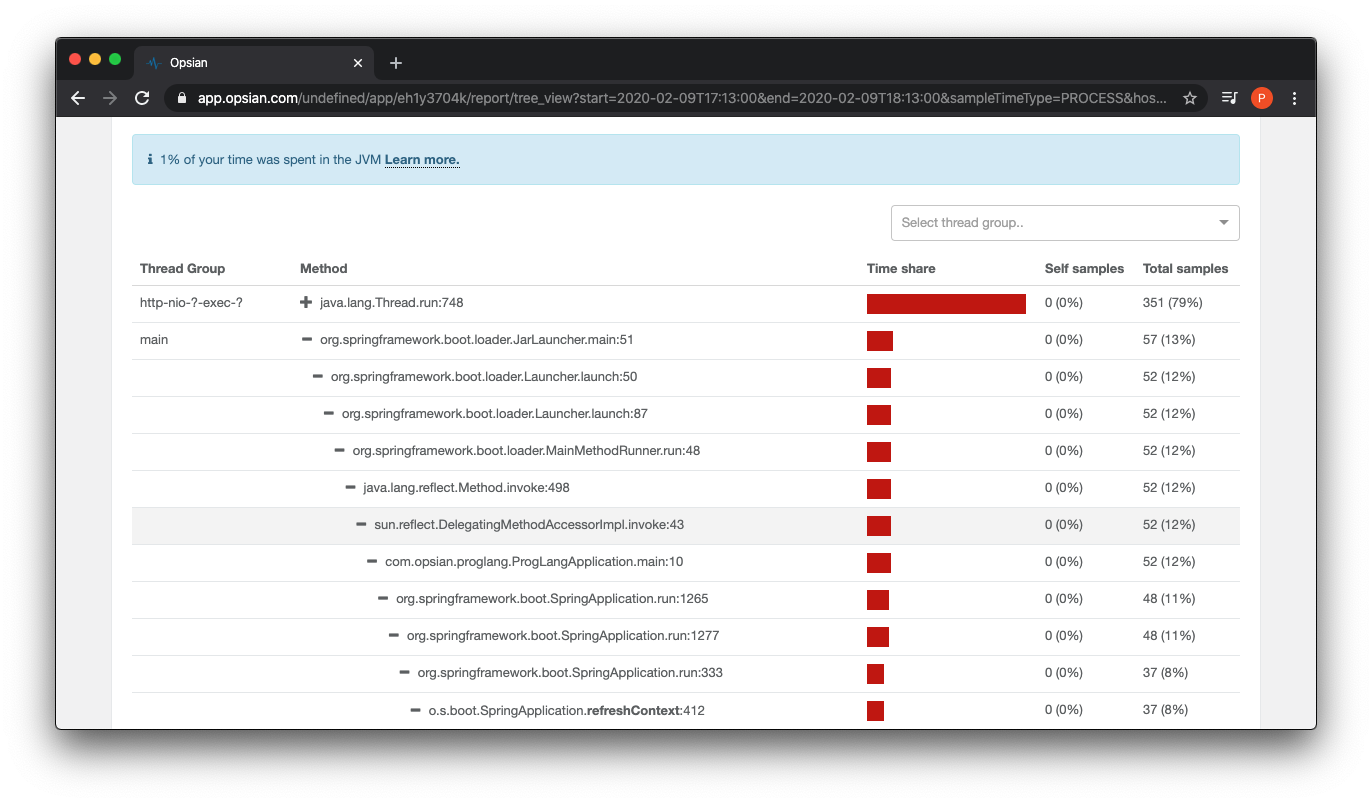
There is also a Tree View in Opsian where we could inspect how much time is spent in methods to identify hot spots running in the app.
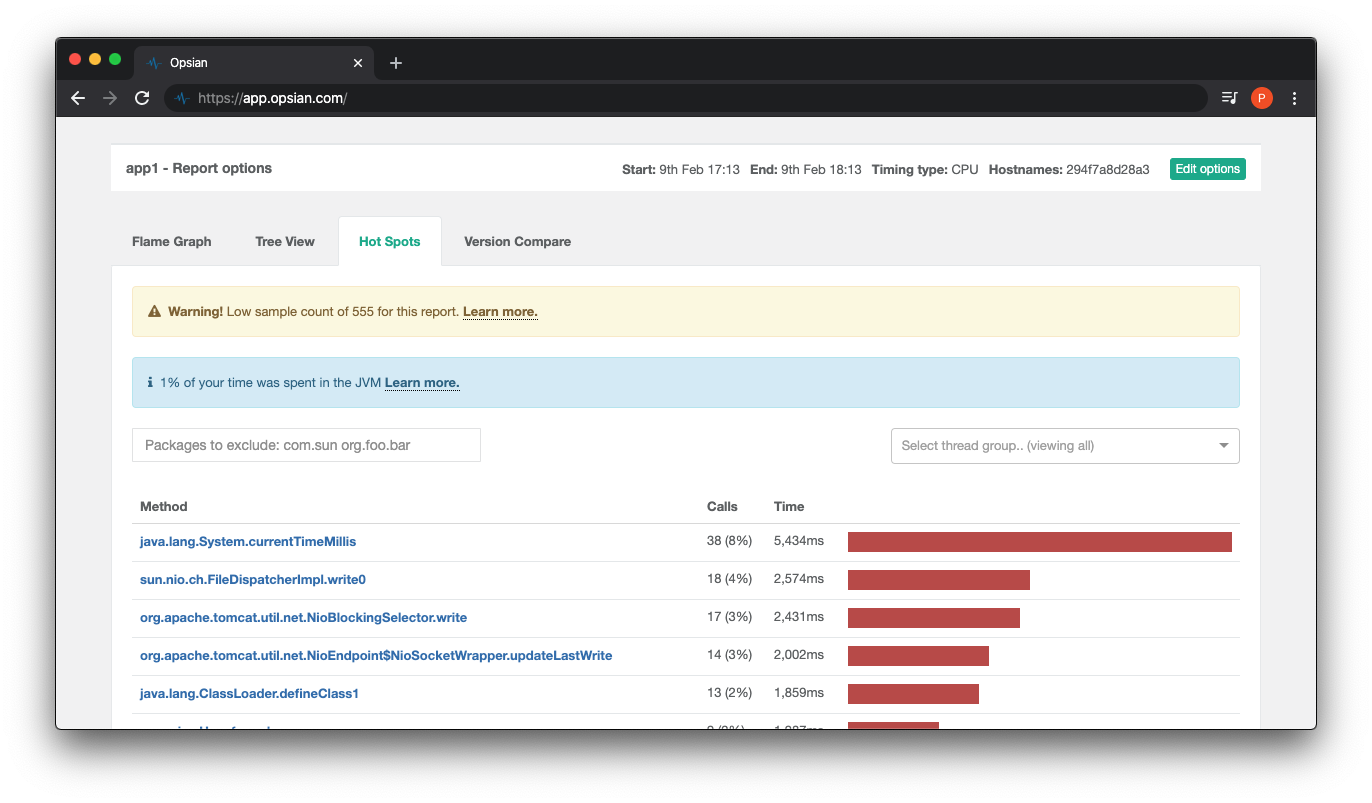
Another view in the Opsian dashboard is a Hot Spots screen which allows the user to see how often a function is called and the average time spent in this method.
Concluding Remarks
This blog post demonstrated setting up and deploying a Java application with Docker, Kubernetes and Opsian - a tool and service for performance profiling. As containerizing applications are becoming more popular it's not surprising that developers want to monitor the application and its runtime.
In fact, because distributed services are finding themselves being used more and more as an architecure style, one poorly performing service could adversly affect the entire ensemble of applications. By profiling with Opsian it is possible to look at runtime performance at a container level and identiy impedences that potentially affect a cluster of application processes.