Bringing Opsian's Continuous Profiling to GraalVM
We’re pleased to announce that Opsian now supports Continuous Profiling on the GraalVM JVM- this means that GraalVM users now have access to the same always-on low-overhead performance data as users of OpenJDK-based builds.
GraalVM is primarily a Java VM and JDK based on HotSpot/OpenJDK with the JIT compiler implemented in Java. By replacing the existing C++-based compilers in the JVM (C1 and C2) with a Java-based compiler it aims to be more maintainable and extensible. It features aggressive inlining and other advanced optimisations such as partial escape analysis, which can substantially reduce the number of allocations in modular Java code. Notably, applications making heavy use of the Streams API can see significant increases in performance. It also aims to support other languages and runtimes such as Javascript, Ruby, Python and even LLVM bitcode all running within the same JVM.
Opsian’s Continuous Profiling gives development teams access to real-time performance profiling data from production server environments via browser-based reporting dashboards. This makes it substantially easier for teams to identify performance issues and proactively carry out performance work to remove scalability bottlenecks.
As of now, Opsian supports GraalVM when run as a Java VM. Work to support Ahead-Of-Time compilation via native-image and other non-JVM languages is still on-going.
Continuous Profiling for the JVM
Opsian’s Continuous Profiling service helps teams rapidly identify performance issues in production environments. It does this by coupling a commercially tested and supported always-on JVM profiler with a back-end service for indexing and on-demand browser-based aggregation of the profiling data. The service is built to run on production server environments with virtually no overhead and enables development and devops teams to understand the production behaviour of applications. The browser-based reporting provides Flame Graph, Hot Spot and Tree View on-demand aggregations over a range of different dimensions, such as time, server names/types and application versions.
Opsian continuously collects CPU time and Wallcock time profiling samples. CPU time reports can be used to identify the causes of high CPU load, such as inefficient code, whereas Wallclock time reports can identify issues around networking, disk and concurrency-related locking and contention issues.

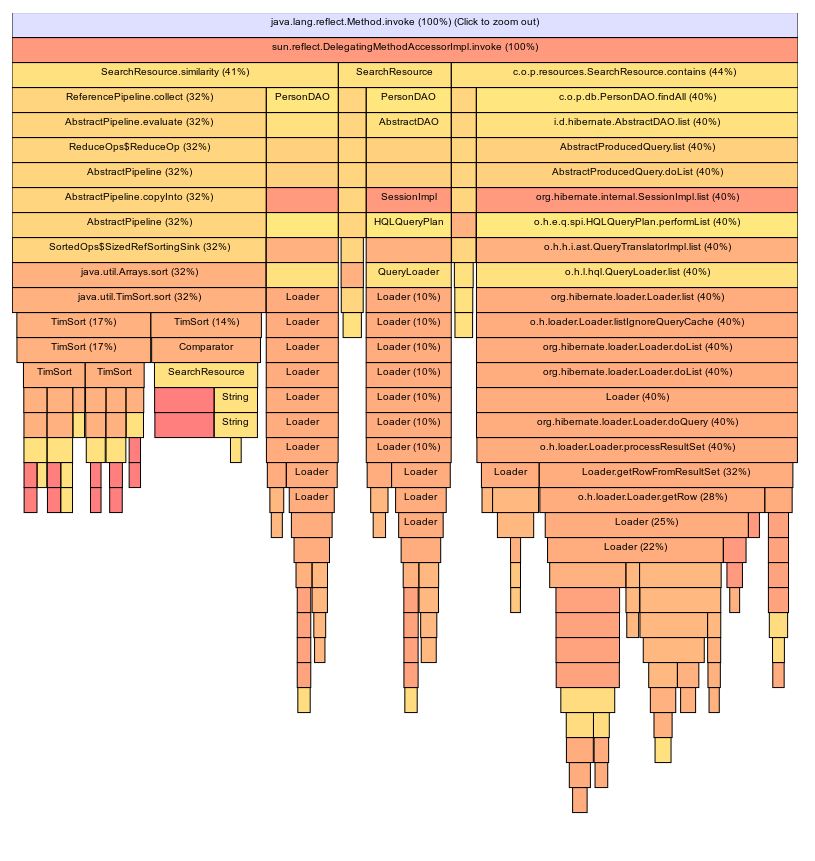
Popularised by Brendan Gregg, Flame Graphs offer a way of visualising a set of stack traces in a form that makes it easier to identify hot code paths and bottlenecks. Opsian provides browser-based Flame Graphs with smart thread grouping, filtering and zooming. This blog post covers them in more detail.

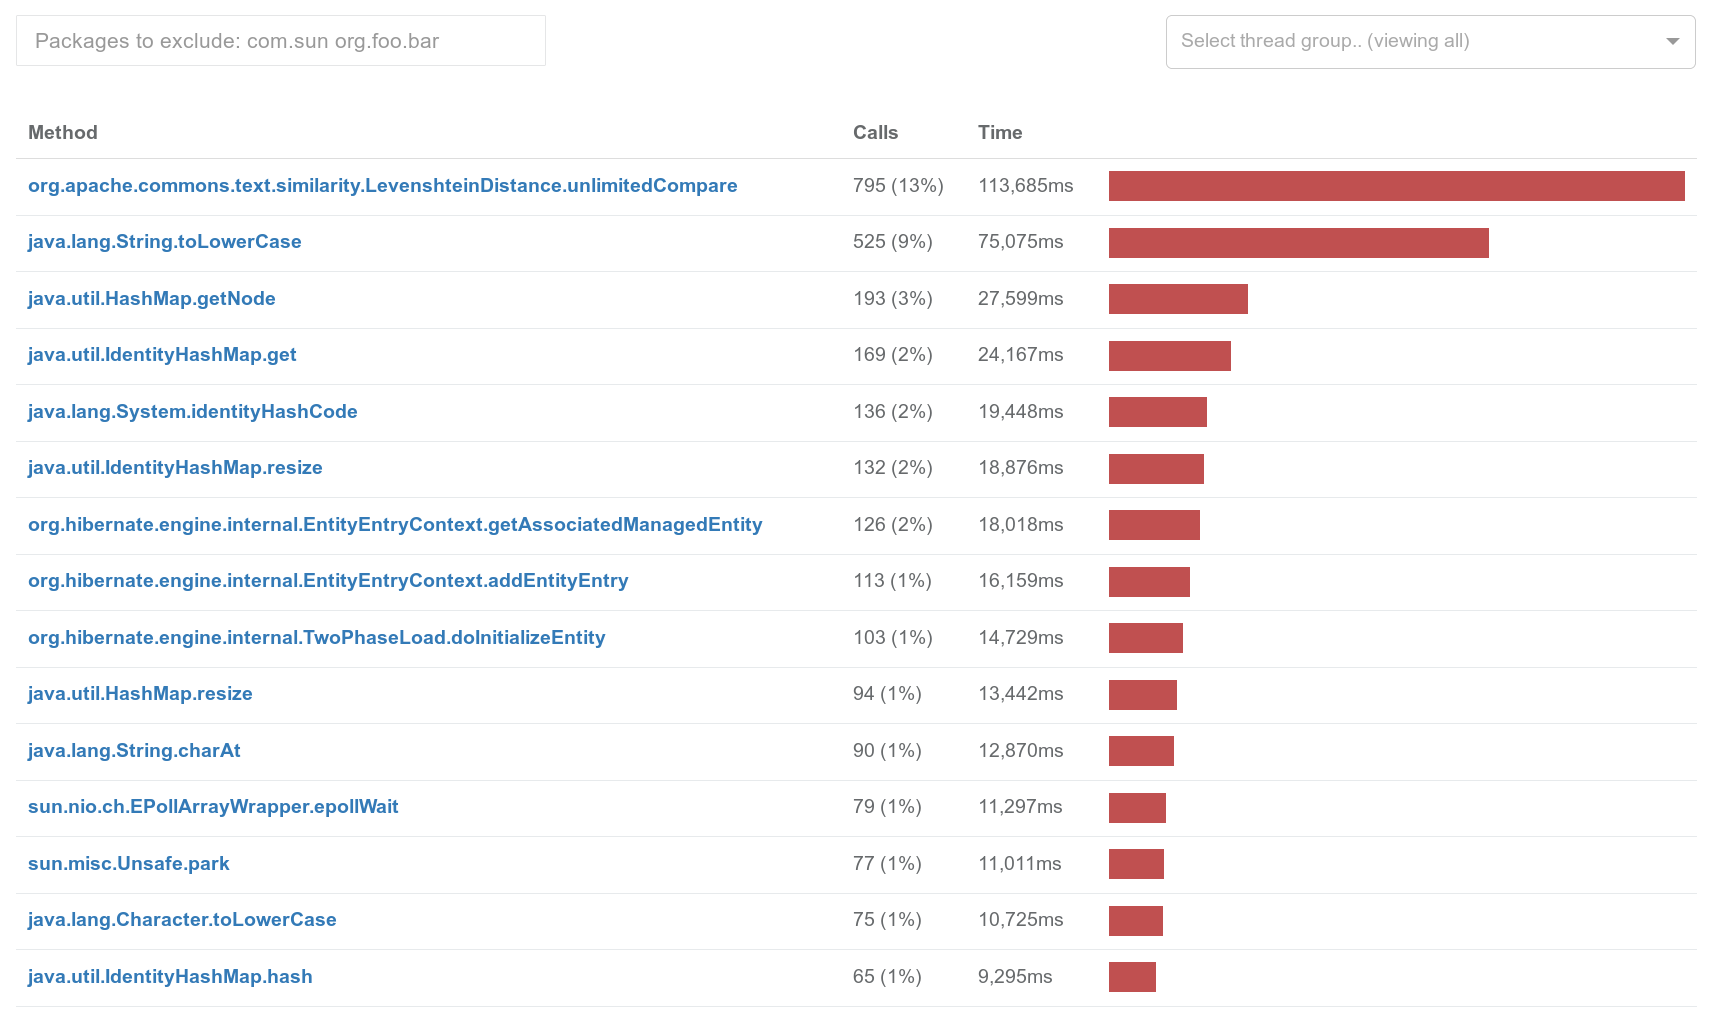
Hot Spots are a more traditional profiling view and give a bottom-up perspective of the most time-consuming methods. Opsian’s Hot Spots provide filtering by package and enable you to dive in to each Hot Spot to discover common call traces and line-by-line performance information from each of the identified hot methods.
Getting started with GraalVM and Opsian’s Continuous Profiling
To start using Opsian with GraalVM you will need to download a version of the GraalVM from https://www.graalvm.org/downloads/ . Opsian will work with both the Community and Enterprise Editions of GraalVM. Once you have extracted the distribution somewhere, you can use it as you would any other OpenJDK installation.
To get started with Opsian, sign up for a free trial. The installation wizard will provide you a link to the Opsian agent to download, as well as the command line parameter to the JVM to load the agent and connect back to Opsian.
Depending on how you deploy your application you will need to make sure the Opsian agent library is accessible for the JVM and that the command line parameter is added to the JVM startup flags. A typical command line for the JVM would look like:
java -agentpath:/path/to/libopsian.so=apiKey=(your api key),applicationVersion=(your application version) YourApplication
Once your application is running, you’ll be able to log in to Opsian and see real-time Flame Graph, TreeView, and Hot Spot reports.
 Sadiq Jaffer
&
 Richard Warburton