Application Profiling vs System Profiling
 Richard Warburton
&
Richard Warburton
&
 Sadiq Jaffer
With modern, complex, computer programs there can often be a variety of different causes for performance problems. You might find them purely execution time bound in terms of your application, they could have garbage collection problems or other bottlenecks in terms of disk or network I/O or lock contention problems. Traditional profilers tend to offer you visibility into application level CPU problems but don’t explain when we should be looking at any of the other possible problems. At Opsian we’ve been experimenting with how to nudge people in the right direction and this blog post explains our approach for representing non-application code level CPU problems.
Application Profiling
The key problem is that application profilers show you what methods or lines of code are taking up your application’s runtime. That’s great if the performance bottleneck that you’re investigating is a pure CPU problem. You can simply find the method that is acting as a bottleneck and either make it execute faster or be invoked less. If the problem is that your application is spending too much time performing GC and you’re just looking at a profiler view then your tooling is encouraging you to optimise for the wrong problem. This can waste your time and result in “optimisations” that actually slow your program down.
It’s not like there’s a clearcut “Root cause” to all performance problems either. Holding the assumption that you have a single root cause that corresponds to a given performance problem is a fallacy. It’s often better to take a systems-thinking approach - considering how the entire system fits together and how different components can interact with each other. This is expounded upon more detail, here and here (PDF).
You don’t want to just be profiling the application - you want to have a bigger picture view of the entire system.
System Profiling
As a way of avoiding users just seeing execution information we’re starting to put information about time consumption of the JVM itself in our profiles. This could be time spent performing things like GC. Our initial UI approach was to simply include JVM or GC time as an entry in the profiling views. This wasn’t totally satisfactory as it looked confusing. In a profiling view all the entries are methods, but this was an entry titled “JVM Time (incl. GC)”.
The problem was bigger than that though - it wasn't just confusing, it wasn't actionable for the user. We had no way of directing them what they needed to do next if we flagged that up as an issue. In the newer UI we have tooltips and explanation as to what is going on and what the user should do next as a diagnostic step. Existing profile method entries don't need to provide additional information, they're providing a direct vector into your codebase as to where you can look. Part of our goal with Opsian is to provide actionable monitoring tools - the ability to see where in your system the problem is.
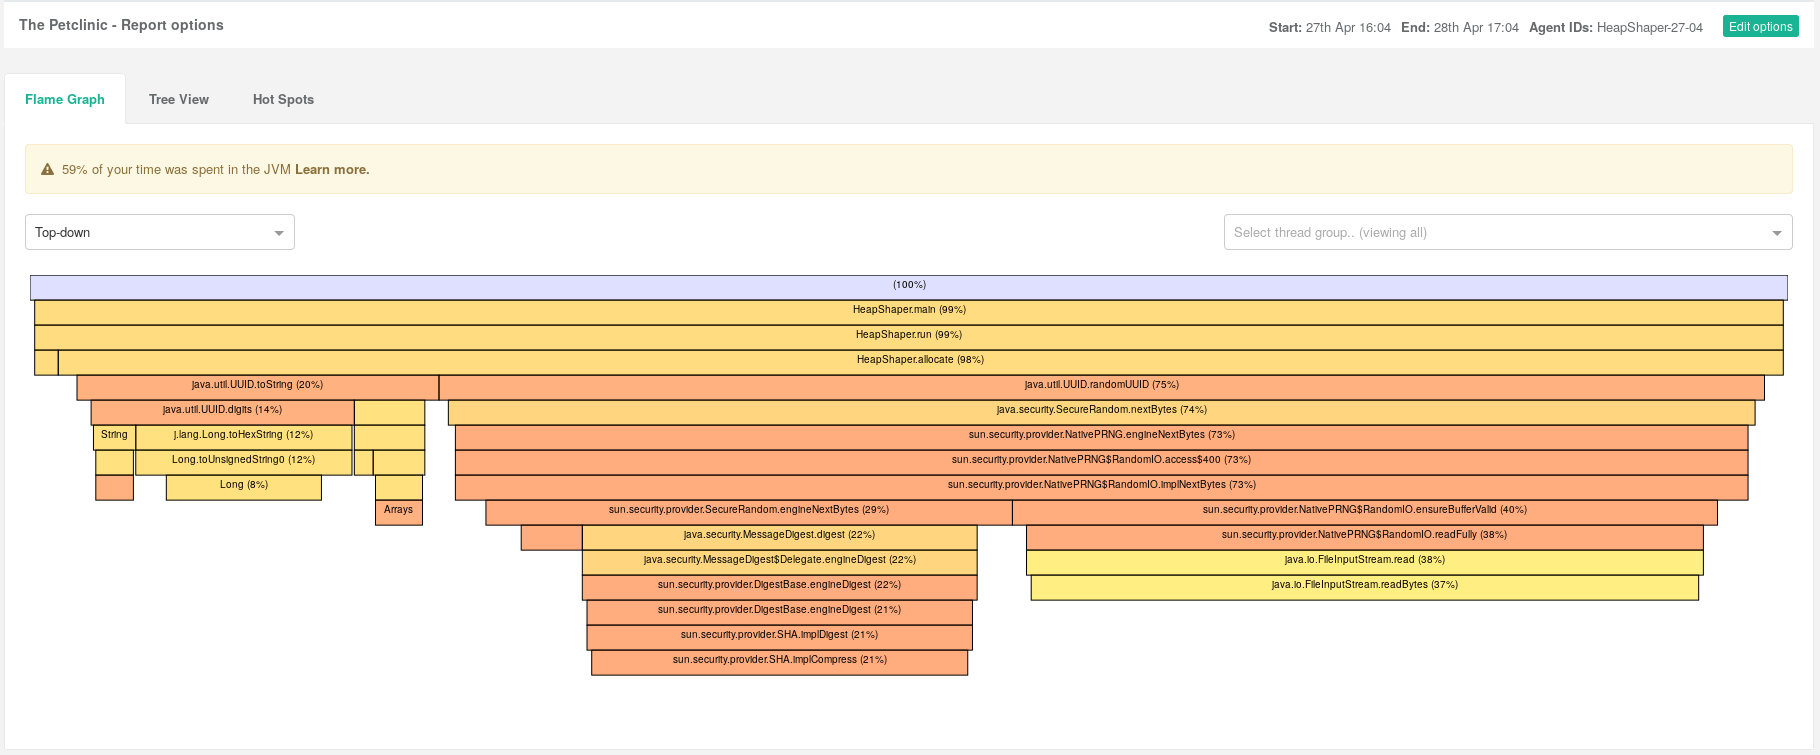
The second UI iteration includes the sample rates for time not spent directly executing Java code above the profile view. These are normally information boxes but if the proportions are too high then we make them warnings. Here’s an example of our FlameGraph UI view profile for an application that’s spending lots of time performing GC:
Comparison
This approach isn’t an alternative to looking at JVM specific information, for example GC logs or memory profiling. It’s goal is to nudge you into understanding the problem more broadly and taking a systems thinking approach to solving problems. Furthermore it's part of our goal to try and build actionable tooling. That is to say tools that help you find and solve production problems. As part of the hybrid approach of profiling and performance monitoring that Opsian offers we’re building out more and more ways to help you understand the production behaviour of your system.