Solving JVM Performance Problems with Profilers: Wallclock vs CPU Time Edition
 Richard Warburton
&
Richard Warburton
&
 Sadiq Jaffer
Time waits for no one, but it will wait for a thread. This blog post can help you solve performance problems more easily by describing the different types of information that you can get out of an execution profiler, why they matter and how you can use them.
Introduction
When businesses suffer from performance problems, they want them solved as rapidly and effectively as possible. Profilers are an essential tool in this process - they can attribute time to different methods, or lines of code, within an application. Telling you what part of your application is a bottleneck so that you can focus your time on optimising the real problem. That's great but when we say that profilers measure time, what time is being measured?
There's really a few different ways of thinking about time and we're going to look at two here. The first is CPU Time. This is the time that your code actually spends executing code on the CPU. The other type of time that we’re interested in measuring is Wallclock time. Wallclock time is the total time between starting an operation and it completing.
 A Coffee Shop
The way that we like to think of the difference between the two types of profiling is that it's a bit like buying a coffee. If you go to any good coffee shop, or a Starbucks at lunchtime, then you'll find they tend to be pretty busy with a queue forming at the bar. In order to drink the delightful caffeinated beverage you desire you need to both get through the queue to be served and also have the barista make your coffee. CPU Time is the time that the barista spends making coffee - it's the actual time spent performing work. The total time it takes for you to get a coffee including waiting to be served.
Now you maybe wondering why CPU Time and Wallclock time aren’t the same number: after-all your Java process doesn’t to have to wait in line at Starbucks. Well code may not be running on a CPU for a variety of reasons. For example it might be blocked on a lock, not scheduled on CPU due to too many threads running or have gone to sleep.
When should you use the different types of time?
CPU Time. There's very little point in trying to measure what's happening off-cpu if you've got a single very hot thread, as many event-loop style applications have. You may see plenty of time being spent in other threads that are waiting around performing background work but aren't actually a bottleneck in terms of your application. So CPU Time is useful when you know you’re bottlenecked on a CPU problem.
Wallclock Time is useful for problems where CPU utilisation seems low but application throughput or latency doesn't meet expectations. This is because threads are probably blocked on something, for example lock contention, times when you're waiting for downstream blocking network IO to happen or running with too many threads so some of them don't get scheduled. The trigger for looking at Wallclock time would be low CPU usage during your period of performance issues.
In order to identify which approach to time to measure you need to take a look at the level of CPU Time used in your production system. Ideally for a production system using a proper monitoring tool, but even simple commandline tools like vmstat can help you. Here’s a screenshot of vmstat output:
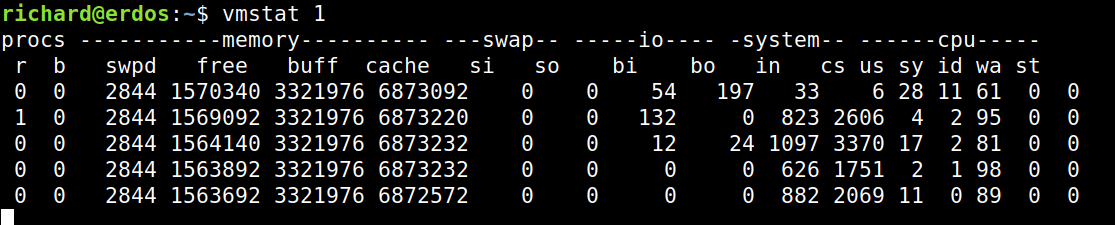
If you take a look at the right hand few columns of the vmstat output you’ll see the CPU time measures. Specifically take note of the columns us (user), sy (time spent in kernel), id (idle, not using CPU), and wa (time spent waiting on locks). If you see nearly 100% of time spent in user then you want to be looking to optimize CPU bottlenecks with a CPU Time profiler. If you see lots of time, for example over 50%, spent in idle or wait time then it’s time to take a look at a Wallclock profiler.
Profilers
Most common Java profilers are based upon the traditional JVMTI measurement APIs, such as GetAllStackTraces. These profilers will only give you Wallclock time based profiling as their sampling approach doesn’t differentiate between code that is actually executing on CPU and off. These profilers also have a high overhead and tend to produce inaccurate results due to Safepoint bias.
A number of other profilers (Java Mission Control, Honest Profiler, Async Profiler, Perf) all use operating system signals (SIGPROF) in order to profile the program in question. These profilers tend to be much lower overhead measurement tools than JVMTI based profilers. They also measure CPU Time rather than Wallclock time.
Our lightweight production profiling and monitoring tool - Opsian - can measure both types of time. It should be noted that our Wallclock time measurement also avoids the safepoint overhead that JVMTI based profilers impose. This enables you to get full visibility on both types of problems, whilst being low enough overhead to run in production.
Conclusions
In order to quickly and effectively solve different performance problems you want to be able to do different kinds of profiling. If you’re using a profiler it should really document what kind of “time” it is measuring, that way you know what you’re looking at and what kind of problems the information is most suitable for understanding. Ideally it should support both Wallclock and CPU Time profiling in order to be most useful for its end user.
Further reading
- Brendan Gregg has written an excellent article on understanding Off CPU Profiling which addresses similar issues.
- Nitsan Wakart talks about the problems that many sampling Java profilers have