How to solve CPU time problems with Continuous Profiling and Flame Graphs
 Richard Warburton
&
Richard Warburton
&
 Sadiq Jaffer
In this video we will look at how Flame Graphs from Opsian's Continuous Profiling system can lead to a 25x increase in performance on an example system exhibiting CPU time problems:
Transcript
Hello my name's Richard and welcome to this demo of Opsian which is a low overhead production profiler that you can leave always-on on your production systems. In this video we're going to demonstrate how you can find and solve performance problems using the Opsian profiler.
The first thing I'm going to do is I'm going to take a demo application that we've made based on the Dropwizard framework and I'm going to start it up. I've configured this demo application to have the Opsian profiler attached as a command-line argument in the start script. We can see that once we've done it appears in our web-based UI as an agent.
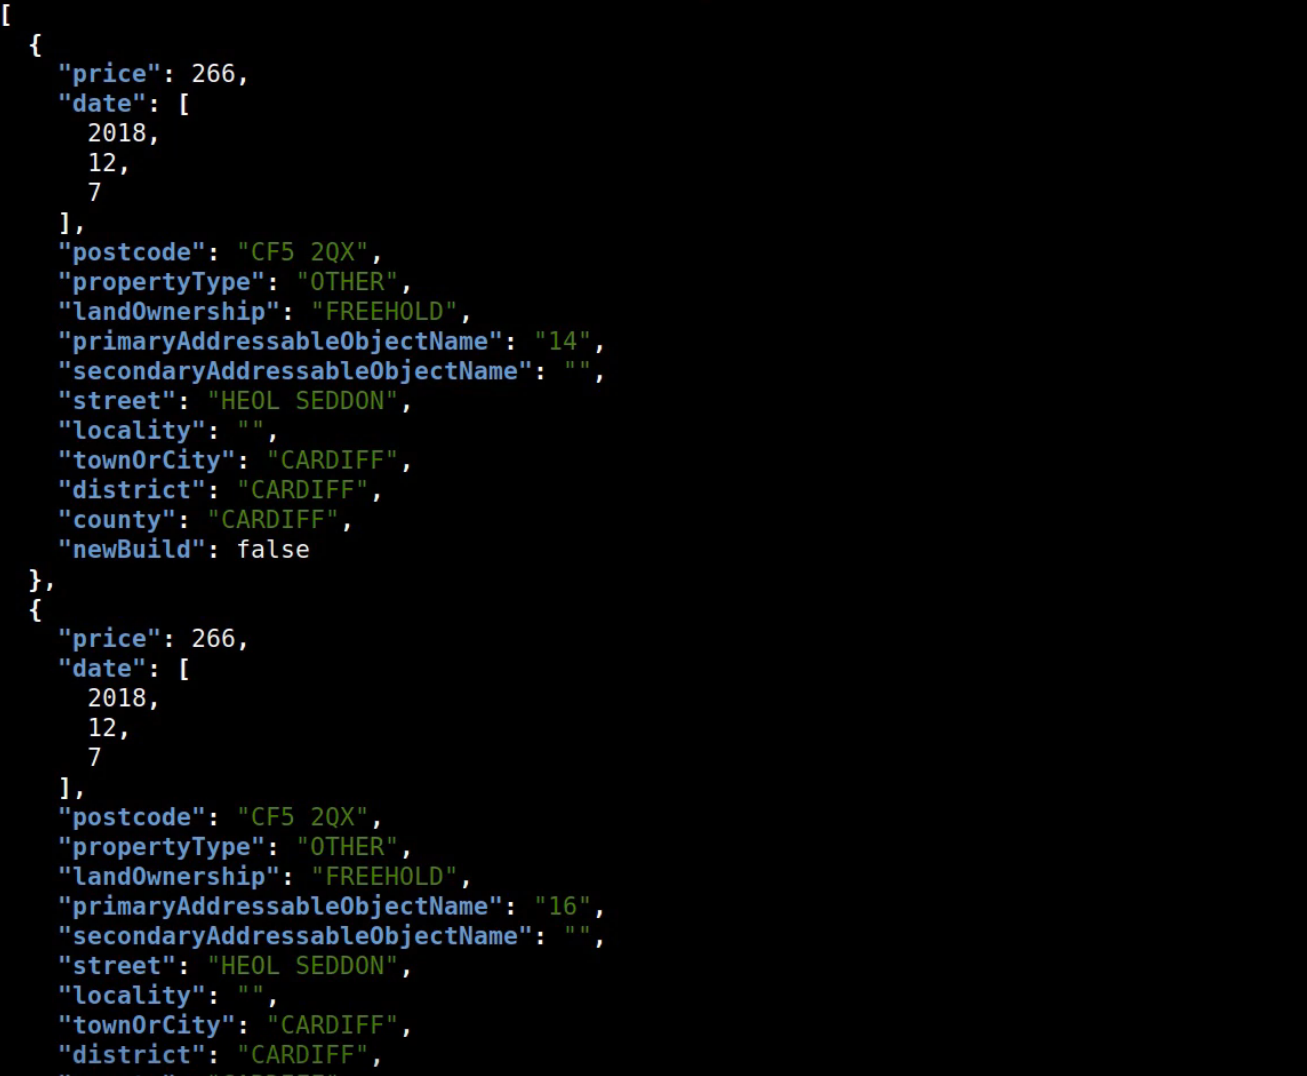
What does this demo do? Let’s first of all run this demo house search script. What this is doing is it's hitting an HTTP endpoint and getting some JSON data back. I've loaded this system up with a CSV file from the UK government which contains all the house price transactions in the UK over a given time period. What I've done here with this demo search is to search for all the house transactions in Cardiff and they're all sorted by price so we can see the cheapest is £266 which is basically free and the most expensive is £29,000,000. These are all the property transactions.
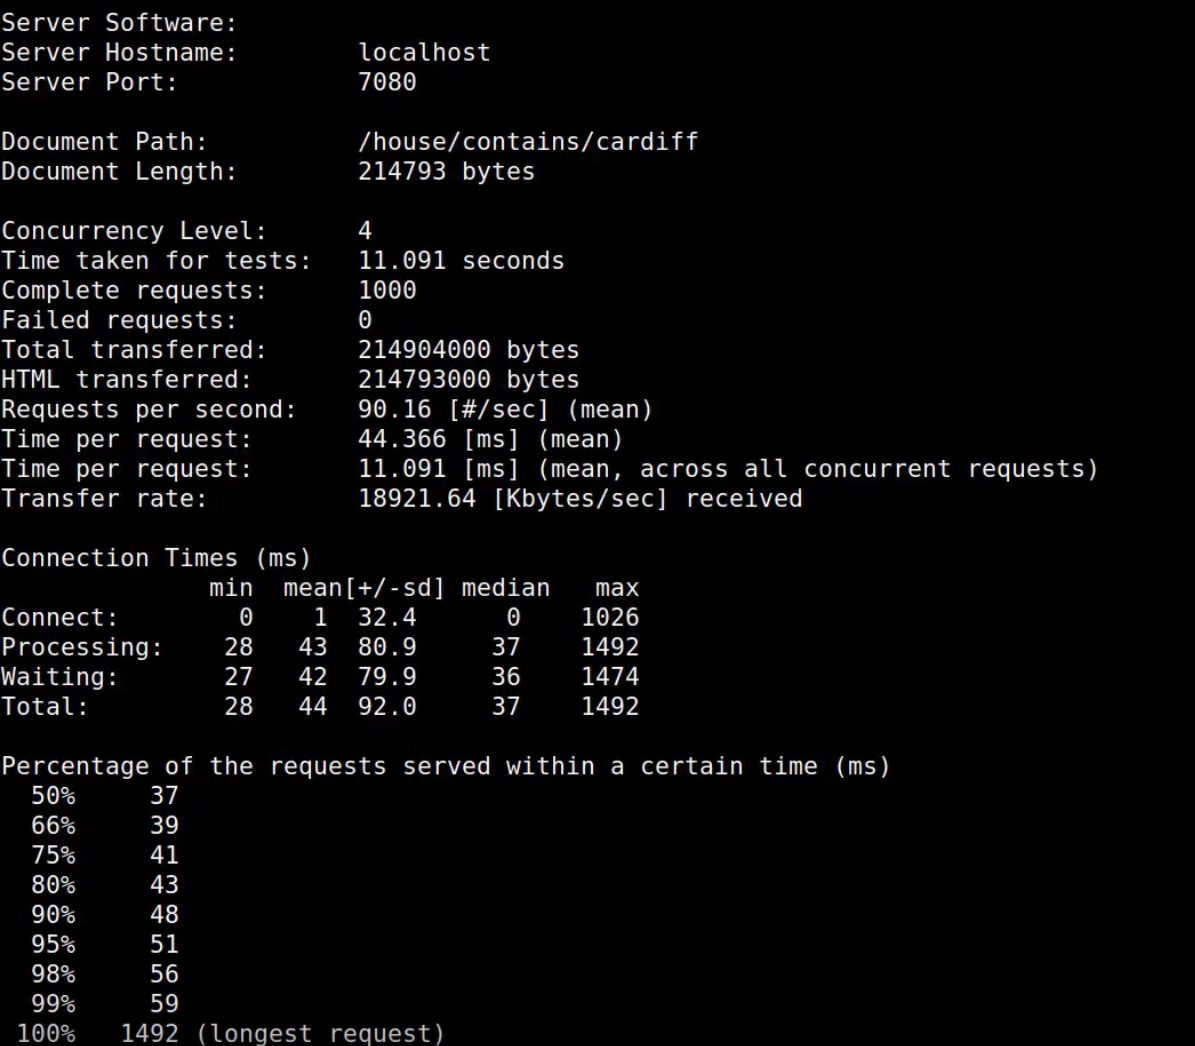
You can see what the script is doing if I ‘cat’ it. It’s doing a curl on a given end point but that's not very useful for benchmarking things so I've also got this script here for doing benchmarking that takes the Apache Bench HTTP benchmarking tool and runs a number of concurrent transactions on this end point. I’m going to run a thousand transactions.
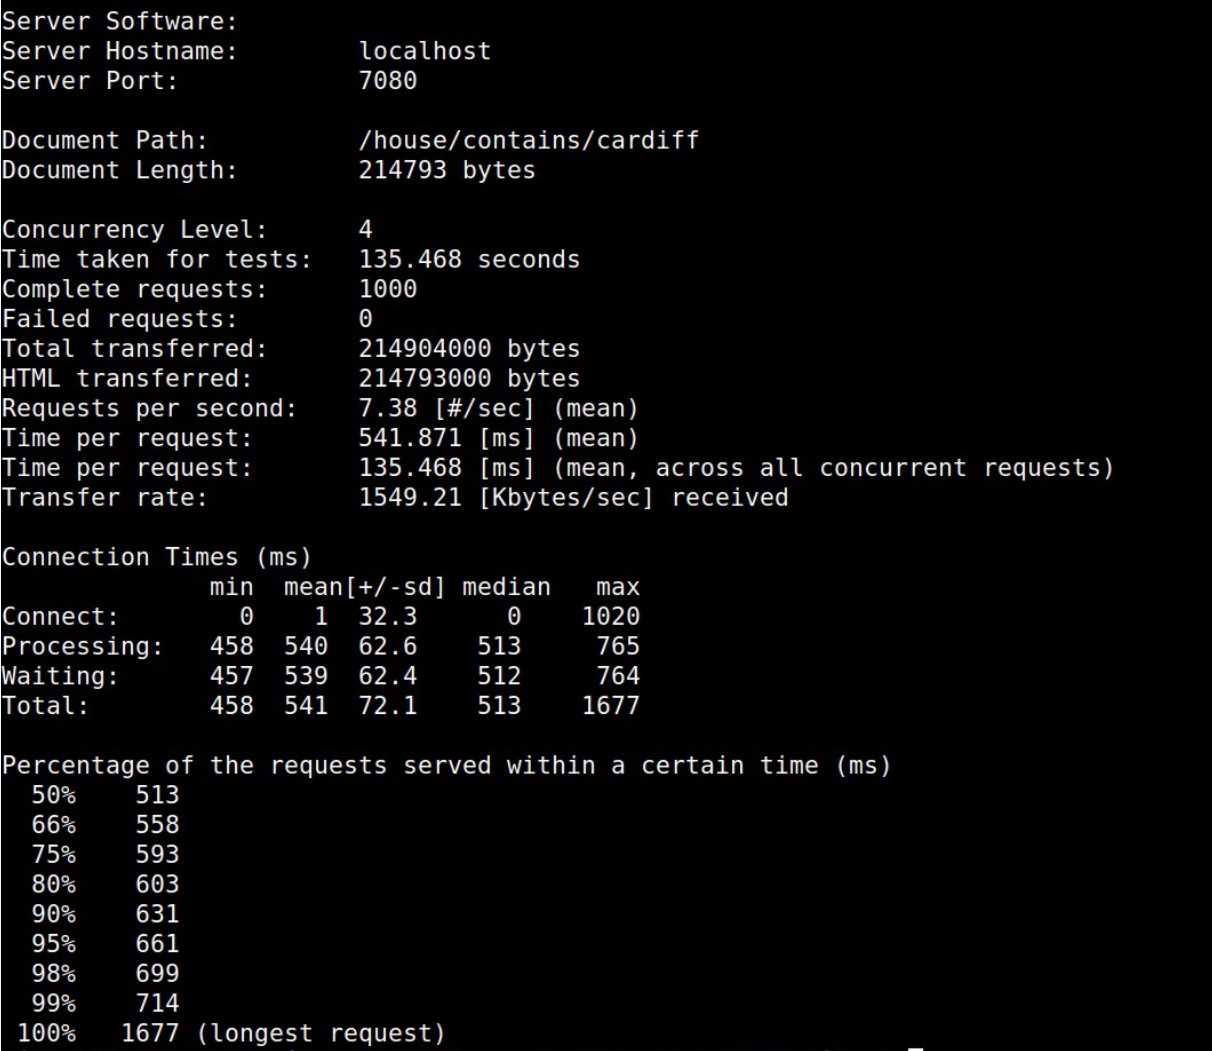
Back. What we can see here is the output of this benchmarking run I've got a little latency histogram. What this shows is 50 percent of the requests were completed within 500 milliseconds and all of our requests were completed within 1.7 seconds. Customers when they're hitting a website often browse away if things are running too slow, so what we want to do is optimize our system here to speed up these requests.
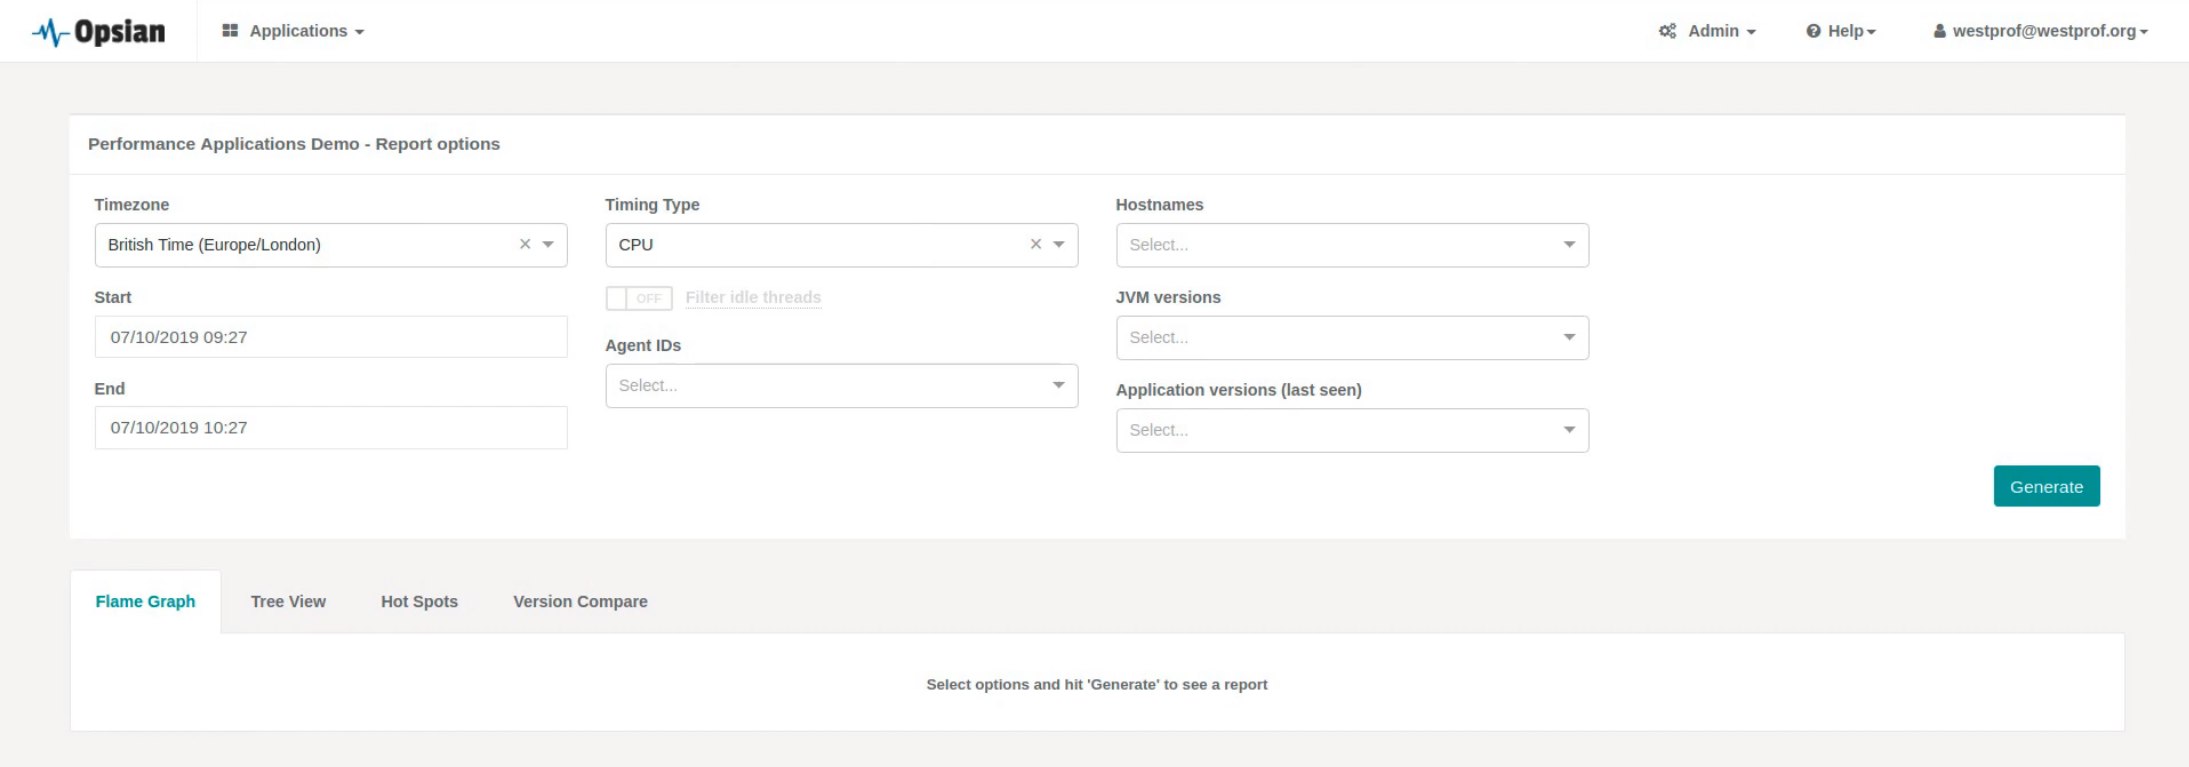
Let's take a little look at our web-based UI that we have with Opsian. We've got our agent here and we can select a time period, so for example it's currently about 11:30 and the agent ID we used there was demo1.
The visualization that you can see on-screen is a Flame Graph. Flame graphs have a bunch of boxes in them and each box in the flame graph corresponds to one method inside your application so java.lang.Thread.run for example calls Jetty’s QueuedThreadPool.run method. The methods are arranged hierarchically within the flame graph so that methods that are above our methods invoke or call those methods. The width of the boxes within the methods indicate how much time they're taking up and you can see here a little percentage as well to show you how much time is being taken up.
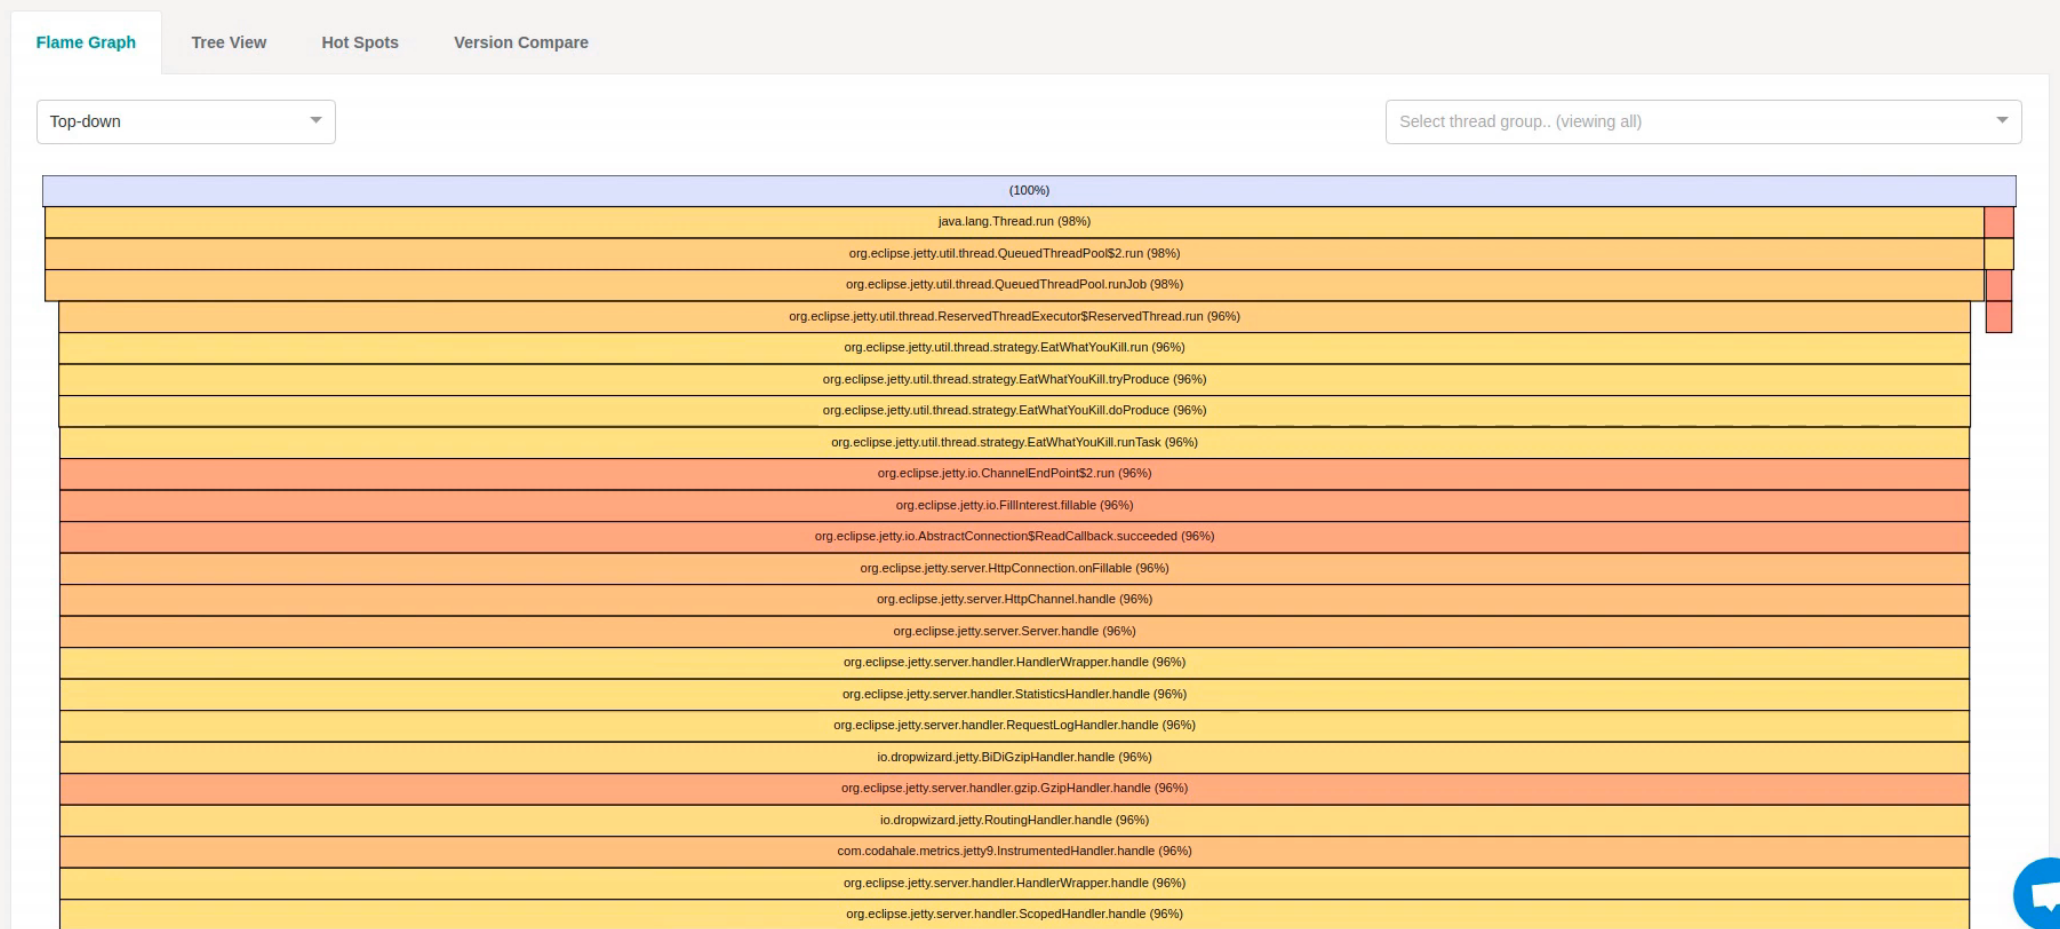
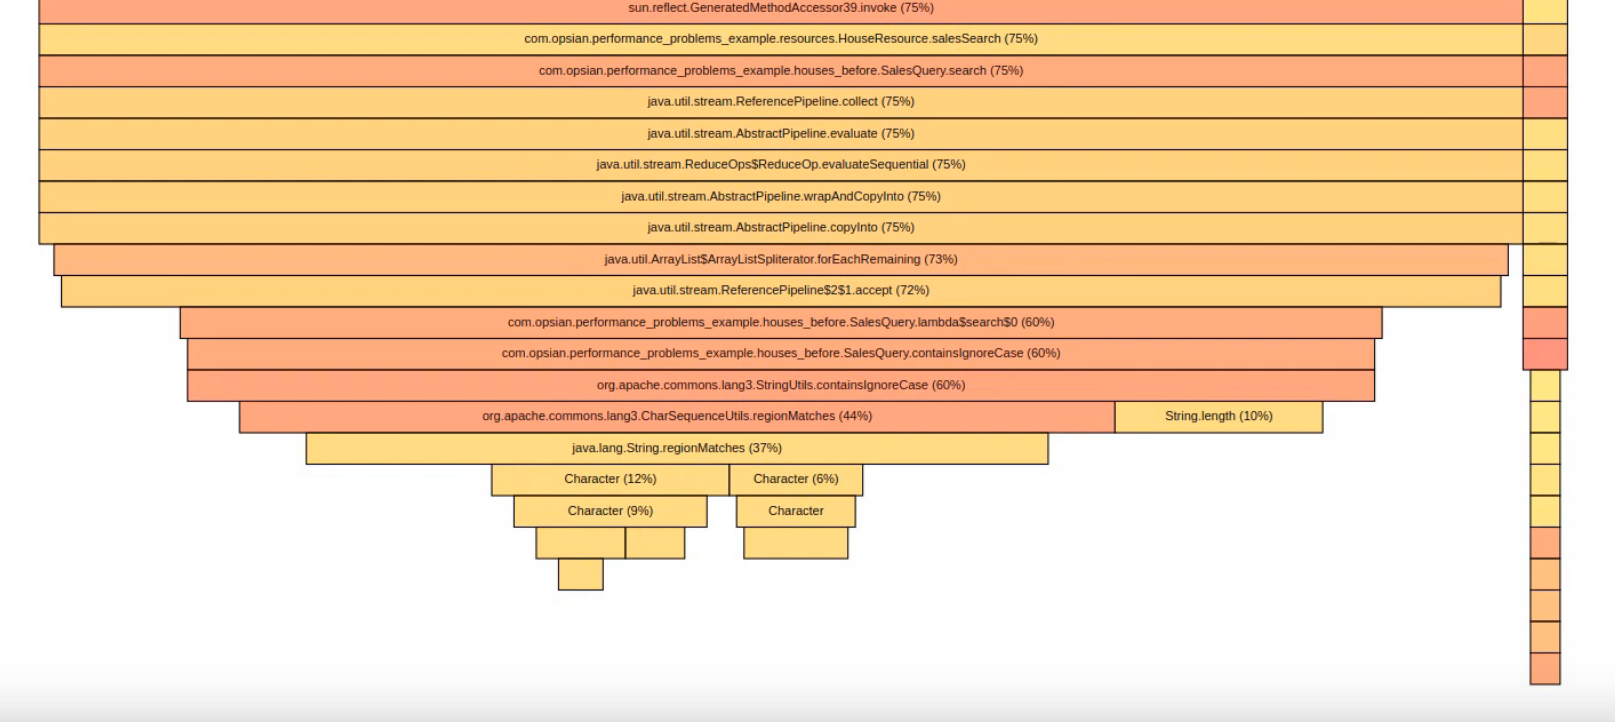
If we scroll down the flame graph right at the bottom you can see we've got our SalesQuery.search method where we actually do our search of the house price information and we can see that nearly all of the time spent in that method.
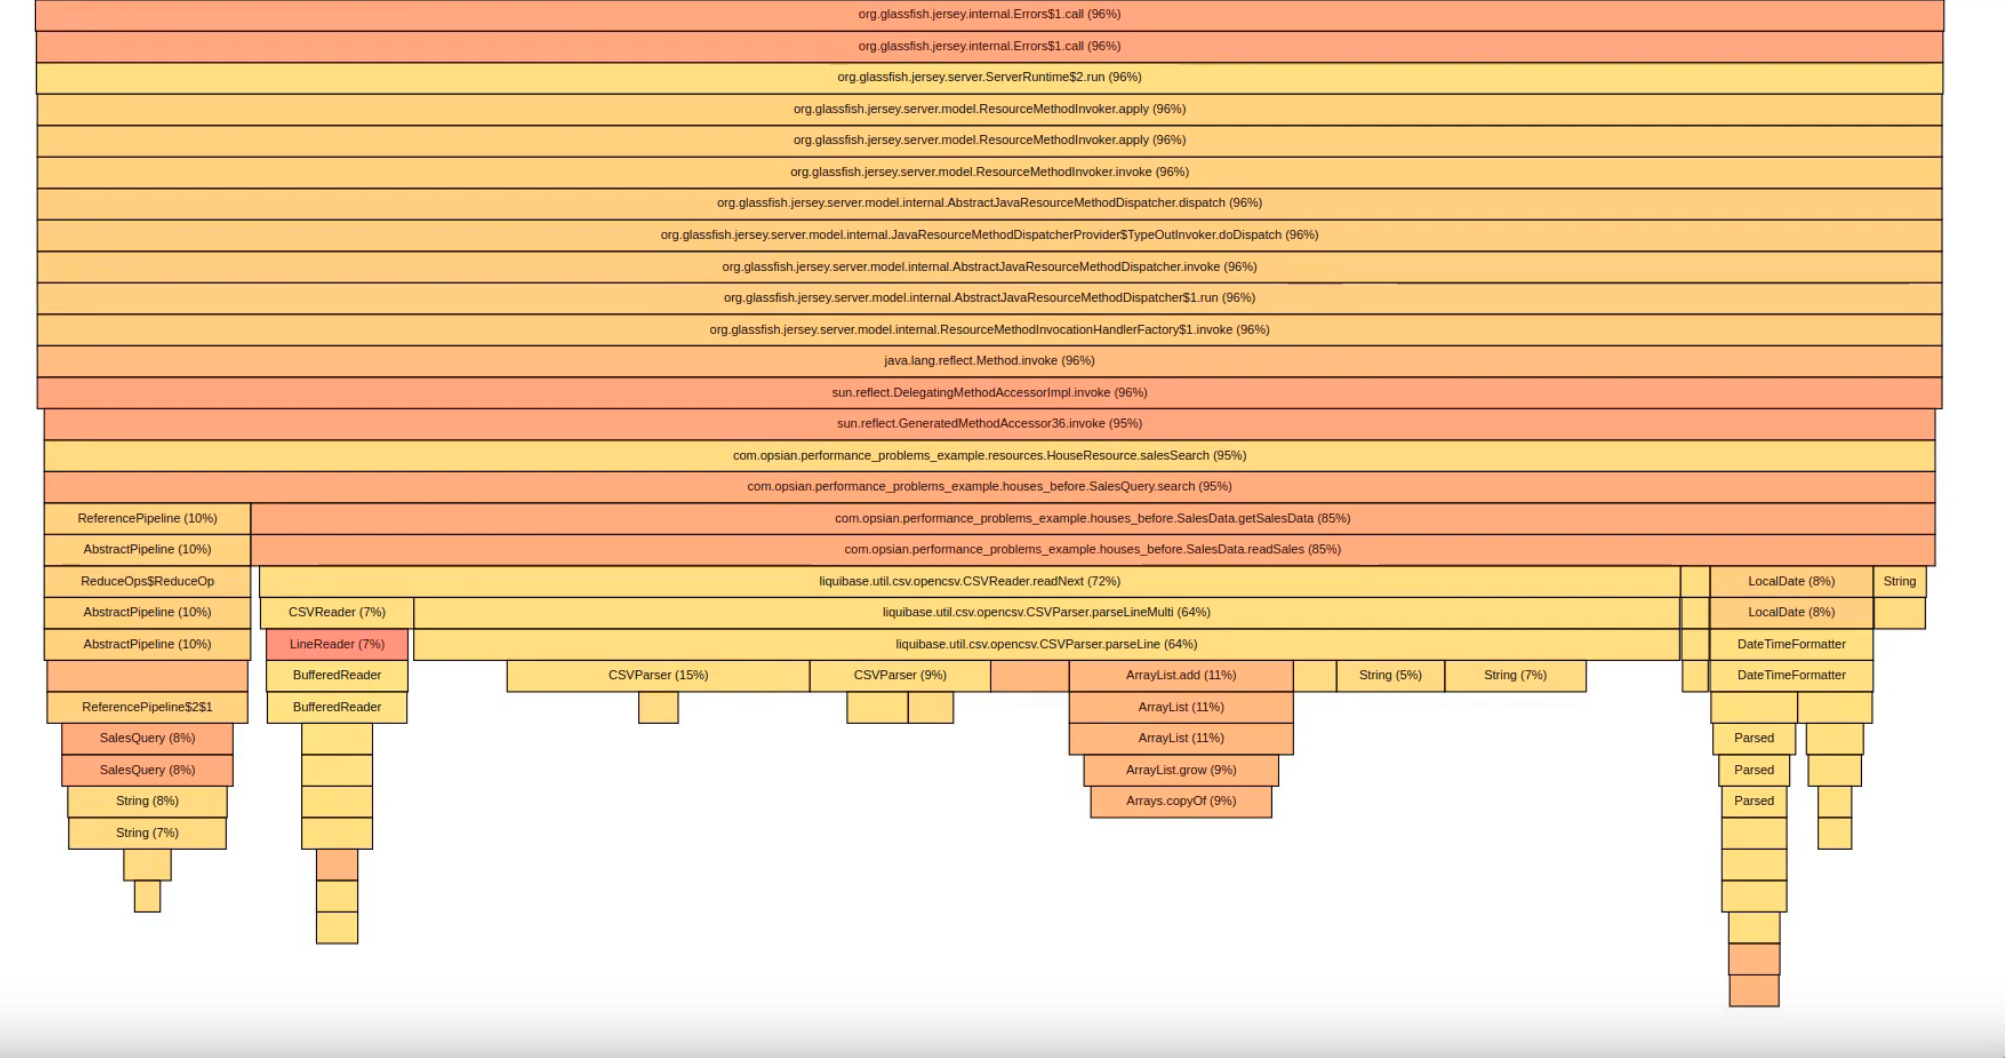
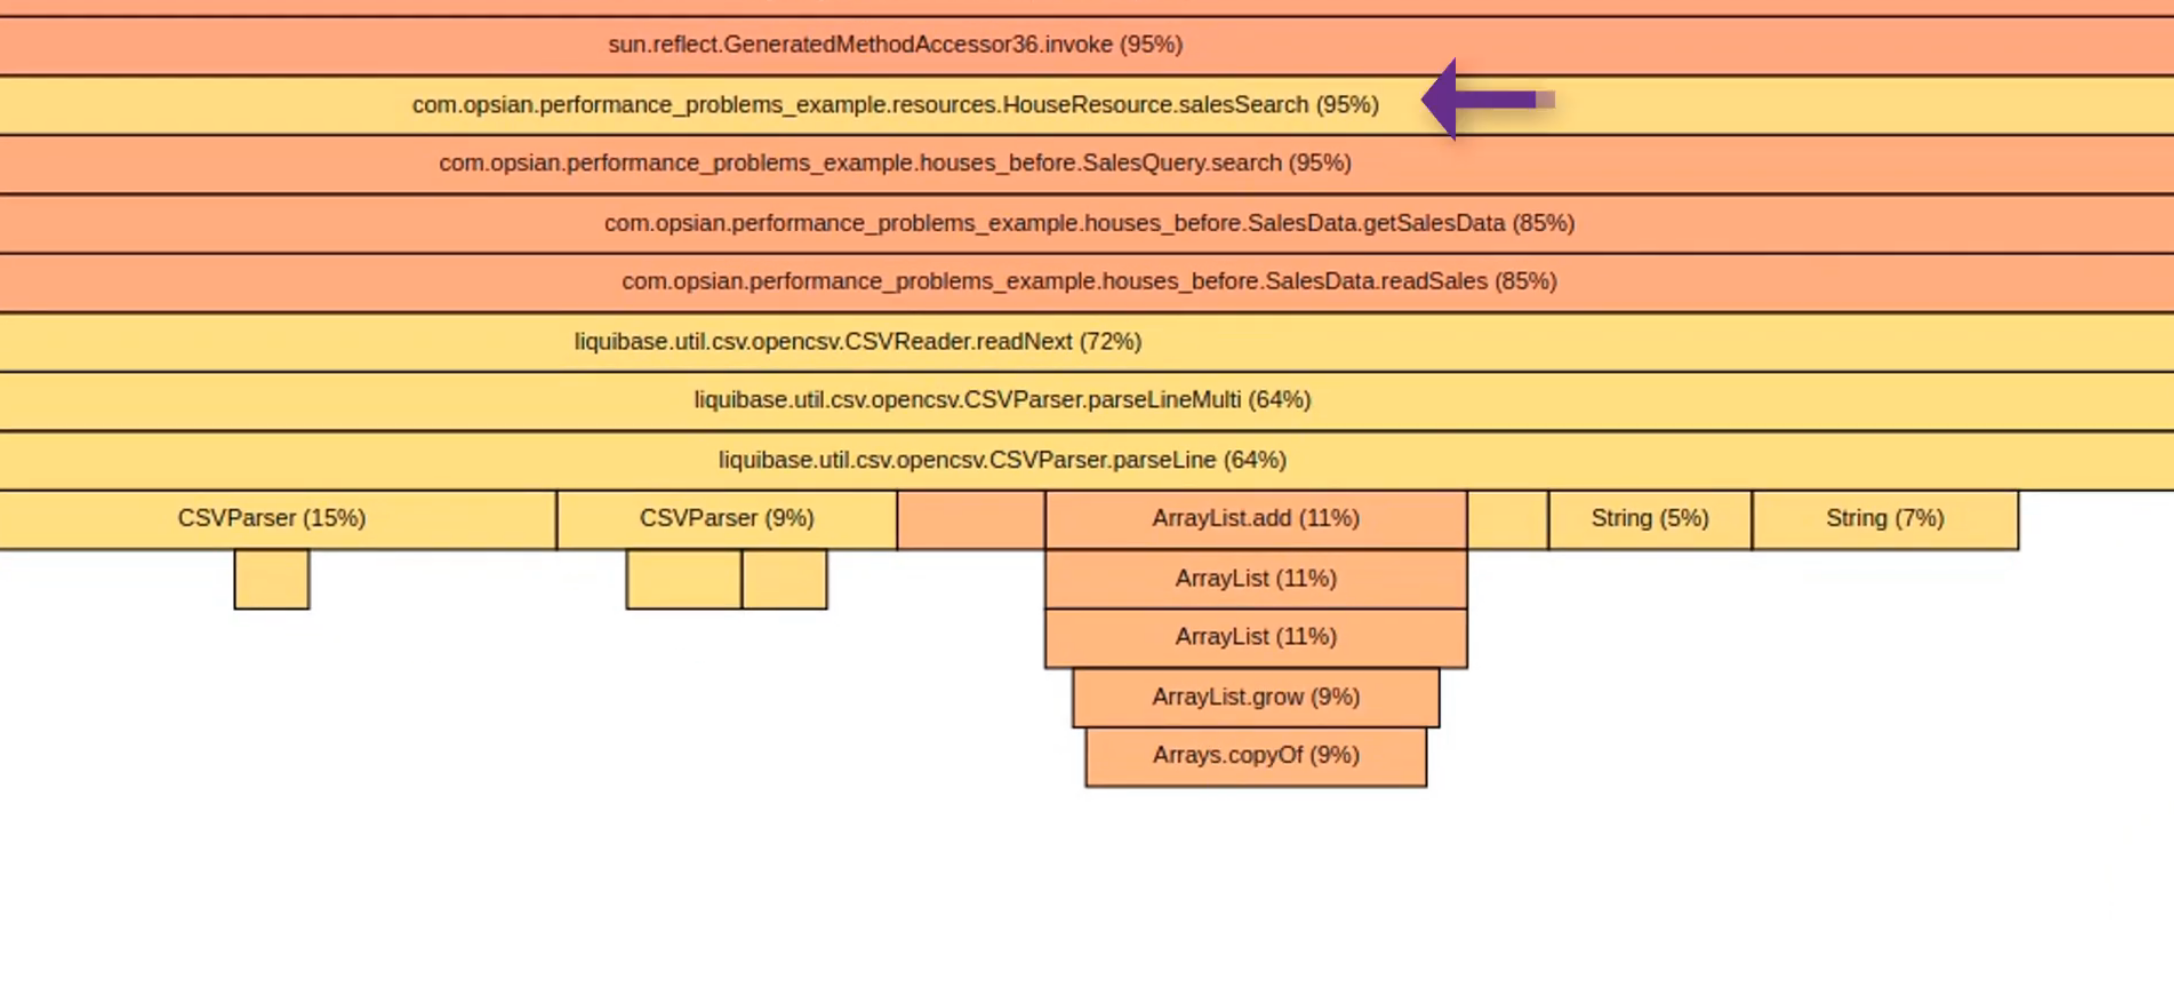
85% of its 95% time is spent in this getSalesData method though. Let’s see what that’s doing. It's spending all its time in the readSalesData method and that's where our flame graph starts to narrow down and flip to other little boxes within readSalesData. We’re spending a lot of our time doing CSV file reading and we're spending a lot of time parsing LocalDates so instead of just finding data and querying data for our house price search we actually spend a lot of time parsing CSV files. That's a bit weird. Let’s have a look at the code in that SalesData.readSales method.
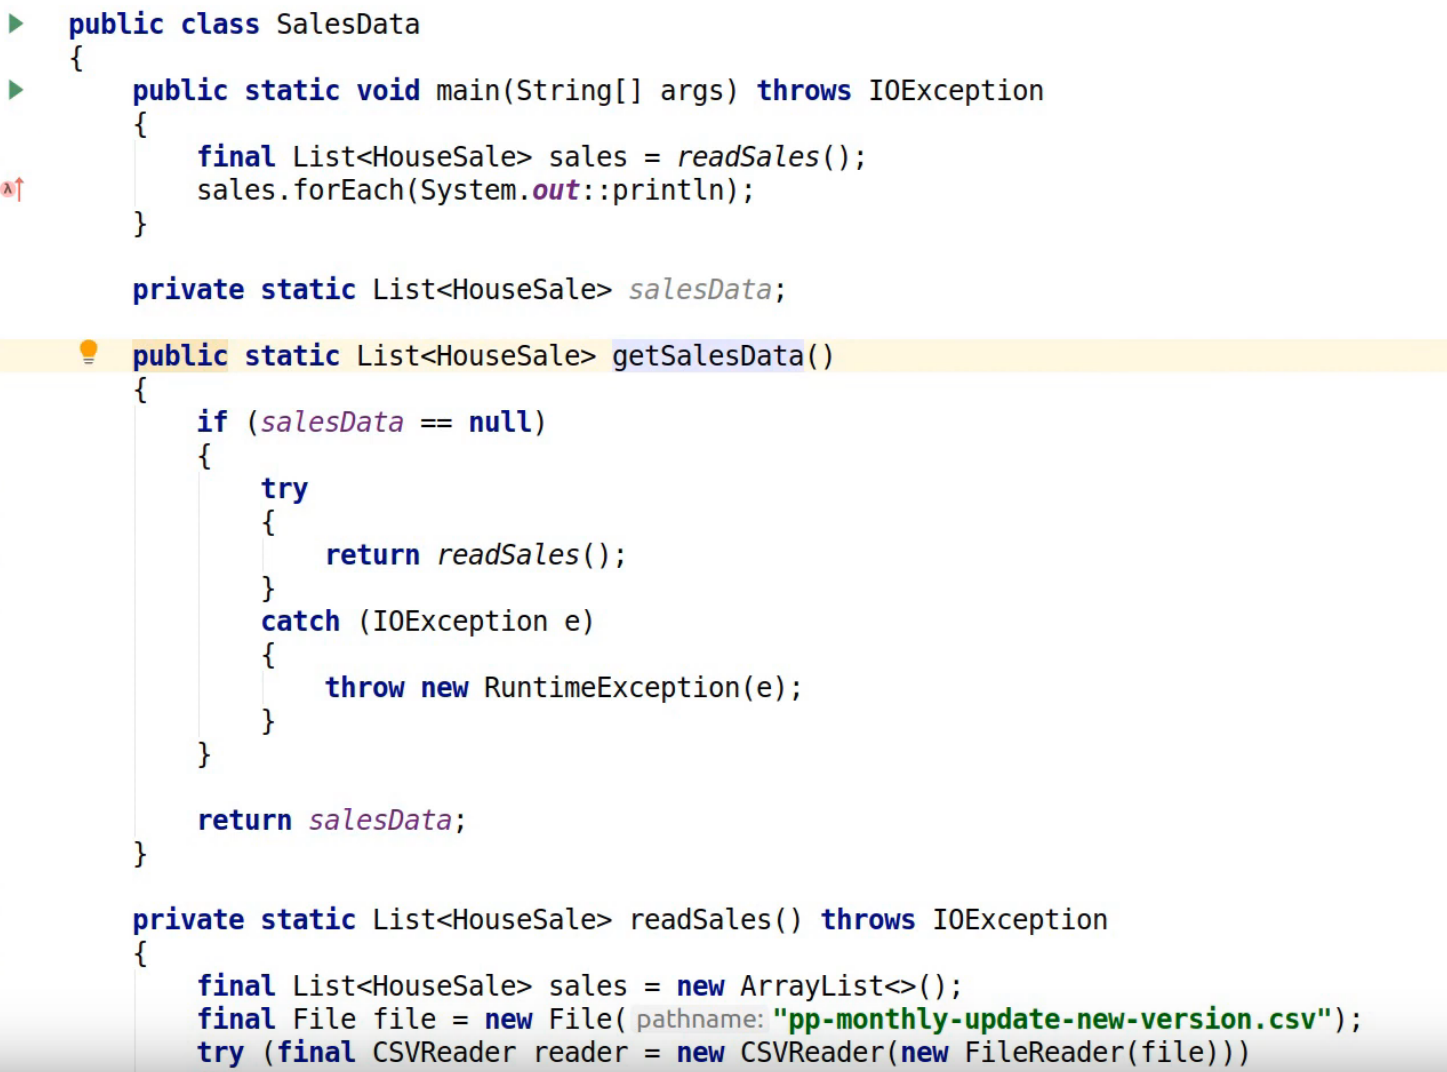
If we take the sales data class we can see what's going on here. We've got a salesData field where the sales data should be stashed. The readSalesData method calls getSalesData and it looks like getSalesData lazily initializes the sales data field. So what's happening here is that we check first of all if salesData is null and if it's not initialized then we try and read the sales data using readSales but it seems that the readSales method never actually initializes the salesData field, which means the results are never cached.
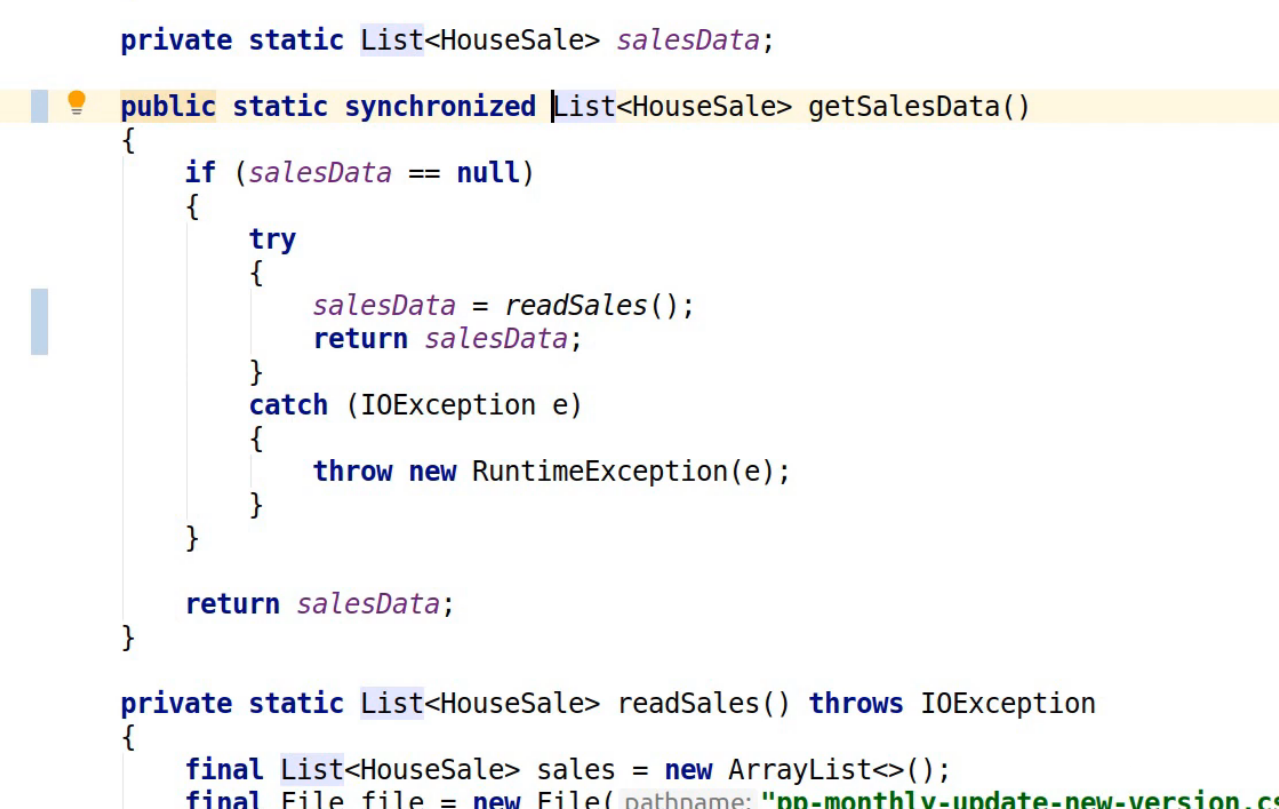
Let’s fix that by taking the salesData field and initializing it this time around and then return the sales data. Now it's worth noting that we also need to have a way of ensuring that we don't have racy concurrent updates to that salesData field because this could be called from multiple threads so that's why I'm adding the synchronized keyword to the getSalesData method.
Let's rerun this benchmark:
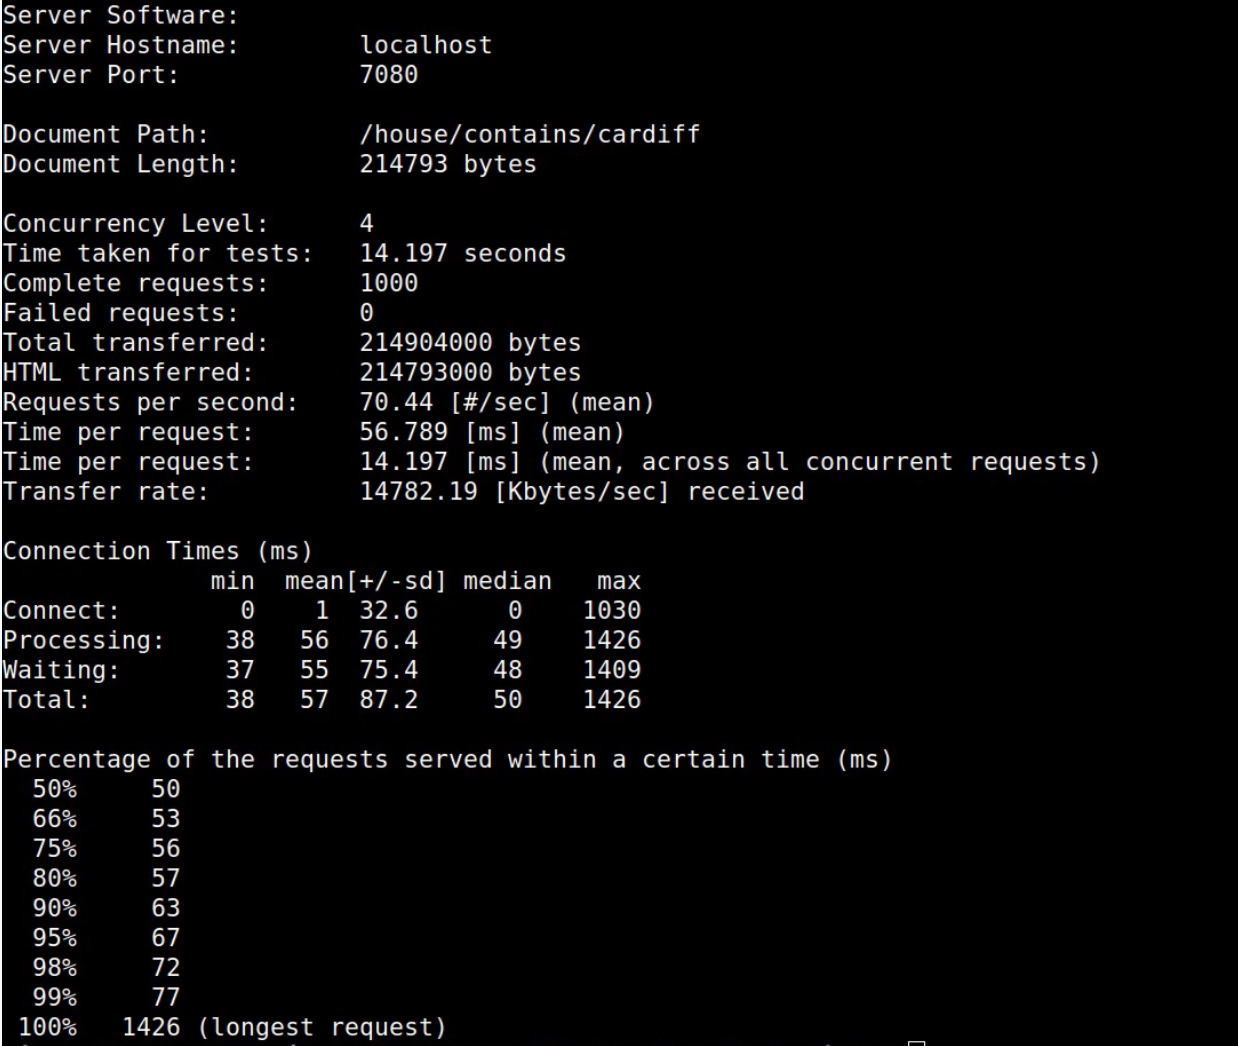
From the results we've basically got a 10x speed improvement from 500 milliseconds down to about 50 milliseconds. We still have a one-off worst case scenario that's quite bad but that's a big improvement for most users. In a real production environment this kind of improvement has real business benefits: it can reduce operational costs, make an application more responsive and help you scale.
Let's go back into our profiling data and see what the biggest bottleneck now is by looking at the flame graph for our most recent run:
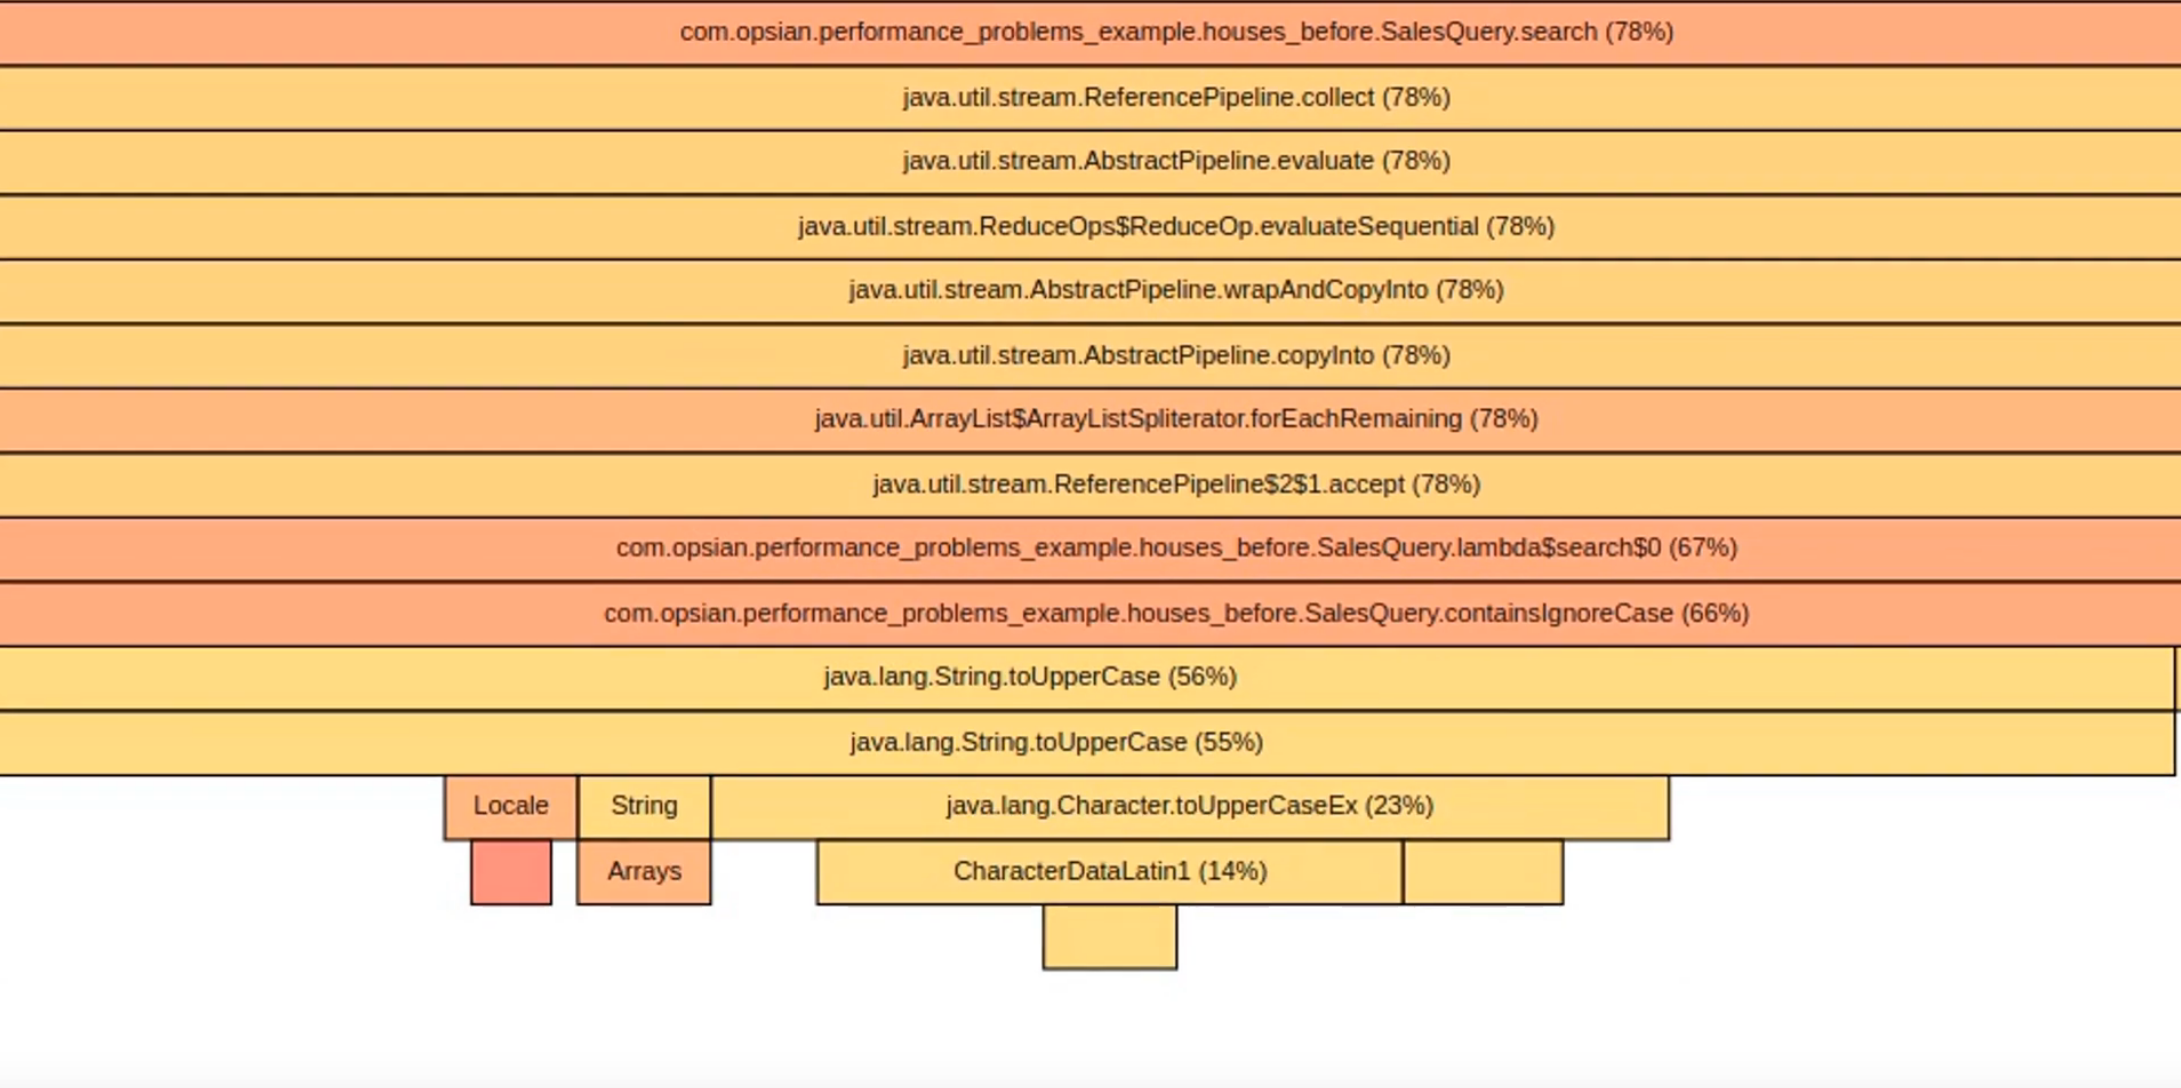
It's still mostly within the SalesQuery method. We can see the getSalesData method has entirely disappeared as a CPU bottleneck. We can see that the Java streams pipeline collect operation here takes up most of the time. The way the Java 8 streams API works is that the intermediate operations are lazy so it's only when you do your final operation on the stream pipeline like collect that it actually gets kicked off and executing. If we look at what's spending most of our time here we spend most of our time here inside a lambda expression within the SalesQuery class and within its search method and that is spending most of its time calling containsIgnoreCase. Let’s take a look at those methods in our IDE:
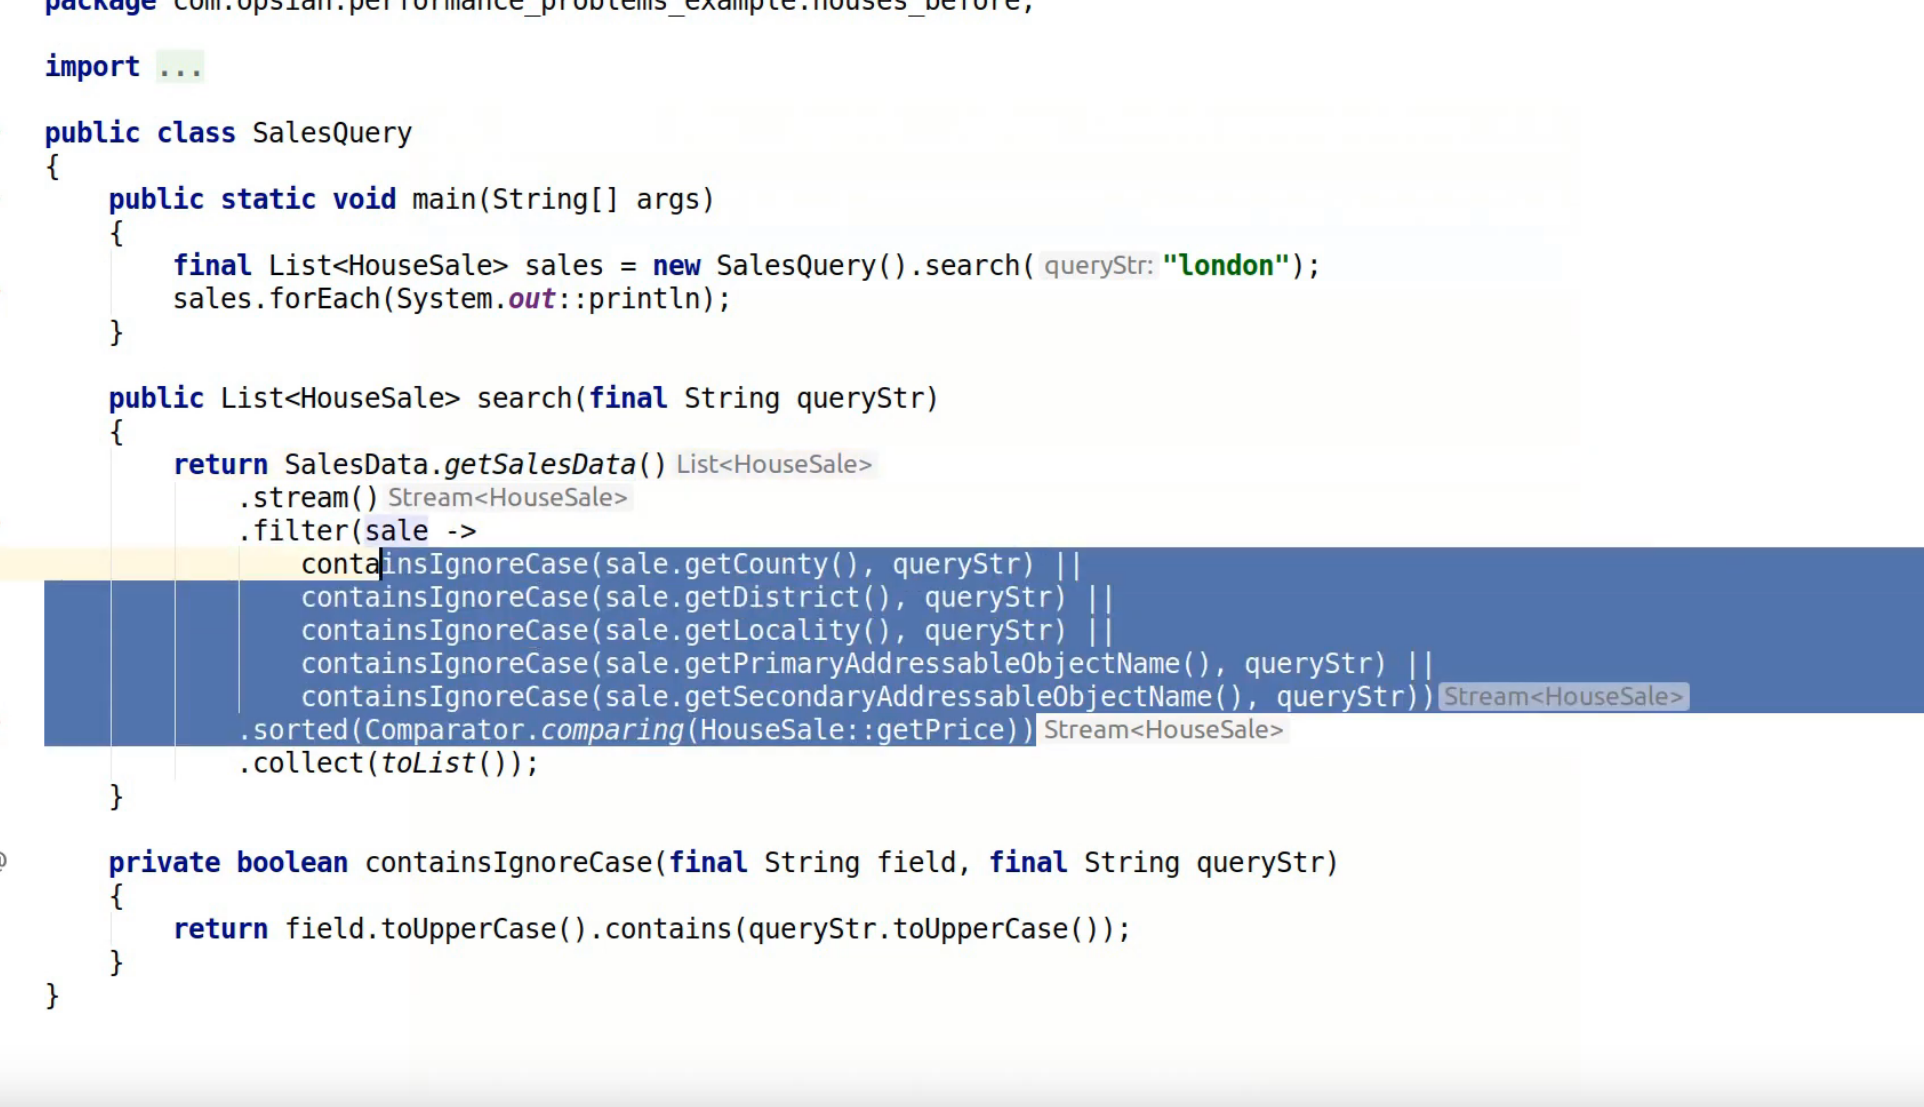
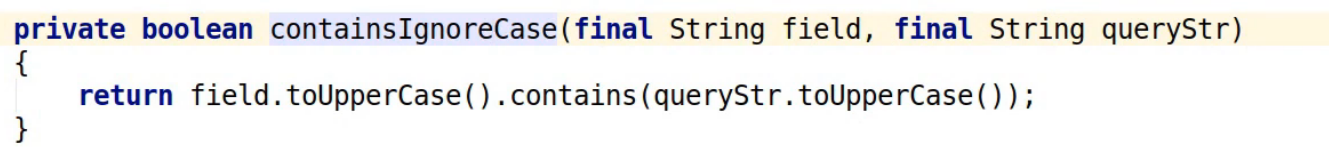
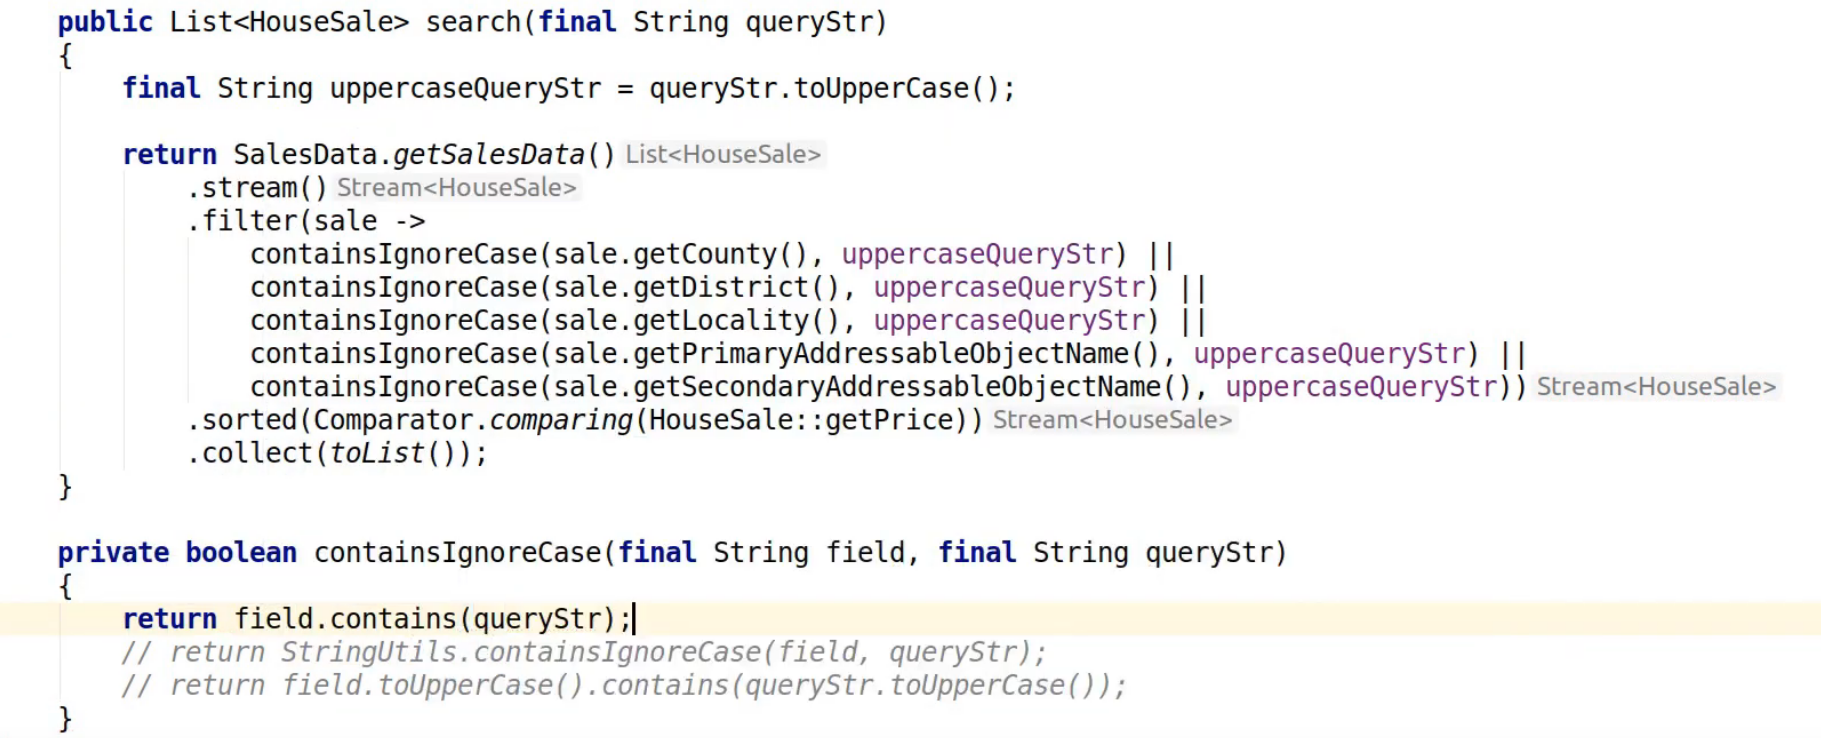
The lambda expression within our search method is doing a case-insensitive comparison between our query string and a bunch of different fields within each sale object. We then sort by price and collect into a list at the end. If we look at what the containsIgnoreCase method is doing it's doing a really simple but inefficient way of containsIgnoreCase which is to call toUppercase on both the query string and the field, and then call contains on the two values.
There are better ways of doing that. For example the Apache Commons library has a class called StringUtils that has a containsIgnoreCase method so we could just take the field and the query string and use that instead. I'm going to restart our demo application and I'm also going to rerun the benchmark:
We were at 50 milliseconds before for our 50th percentile and now we are down to 37 milliseconds so about a 25% speed improvement. Let’s look at bottom of the flame graph for more most recent run:
We've got a pretty similar profile and it's still very much bottlenecked within this lamba application code in the search method. So we've sped it up but our bottleneck hasn't really shifted to anywhere else in the application, we still need a way of improving the performance of containsIgnoreCase. Conveniently, I know because I've had a look at the data that actually all the fields within the CSV file we are getting our data from are all uppercase to begin with. So what we can actually do is take our queryString, call toUppercase on it once and then use that in all the later comparisons.
So that's combining our profiling data on where the bottleneck is with a little bit of domain knowledge that helps us understand how we can simplify our code in the correct way if we didn't have the CSV file all in an uppercase form to begin with we could do something like pre process it before loading it into our system or when we loaded up, do it once which would enable us to apply that same kind of optimisation approach.
Let’s re-run things and look at the result:
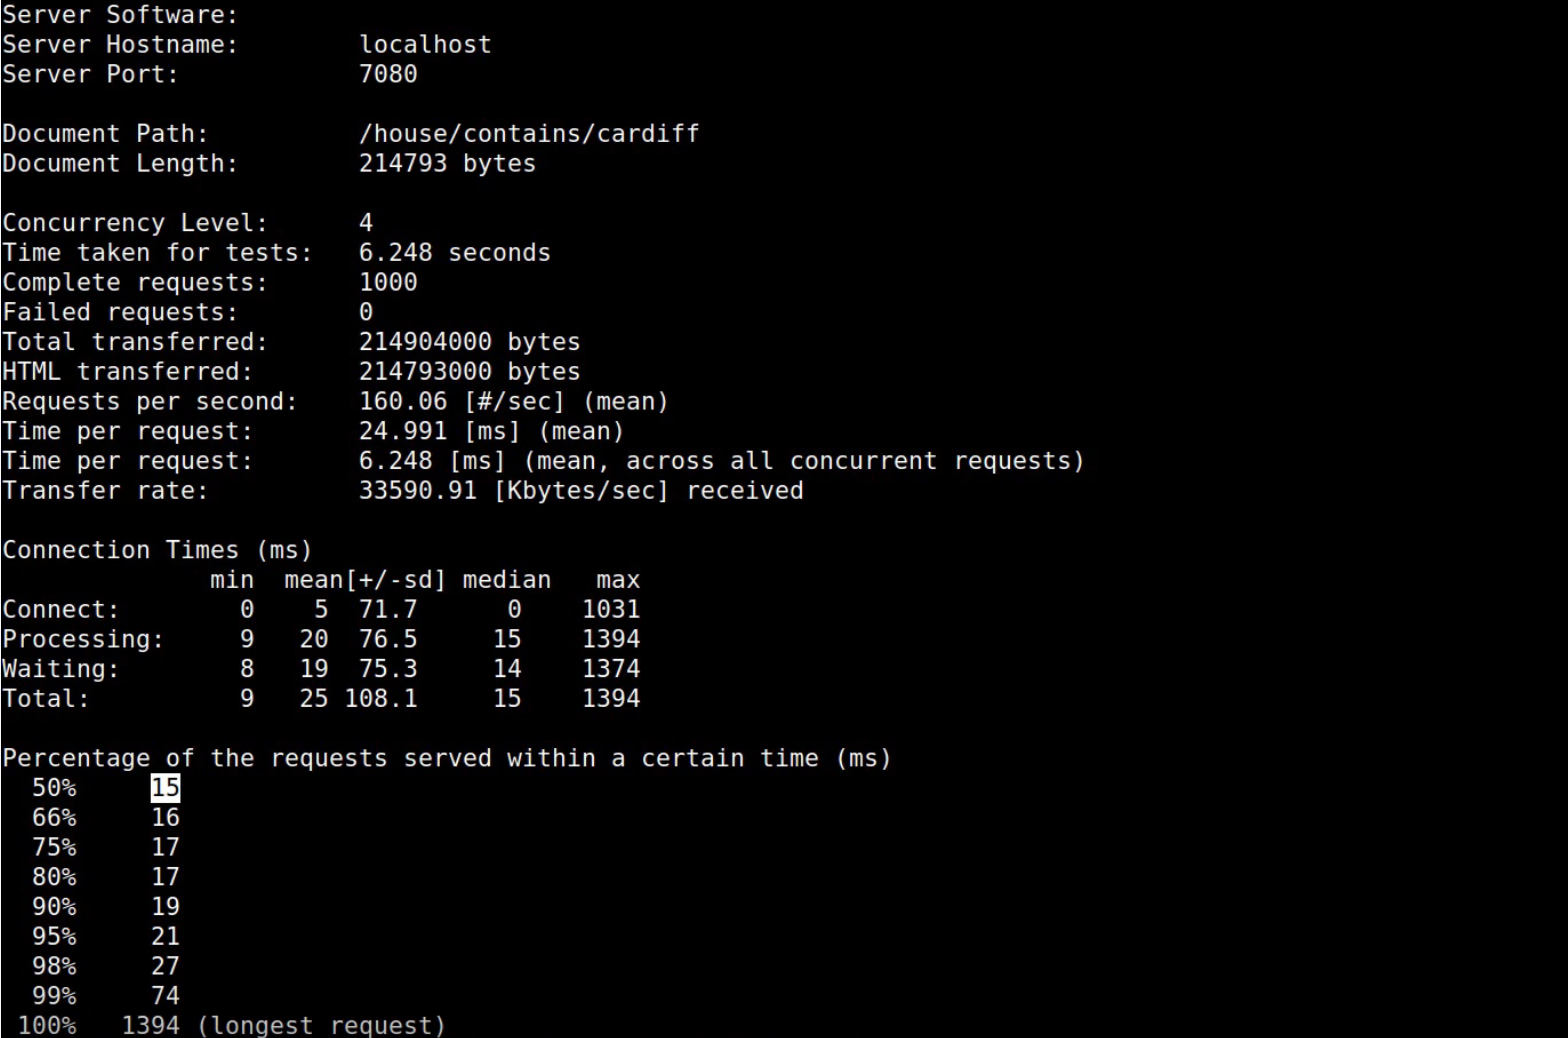
Now we can see when we rerun our benchmark that we're down to 15 milliseconds in the 50th percentile which is way faster than we were to begin with. Twenty-five times faster.
If you are interested in using this demo application yourself, we've put the examples up on github at https://github.com/Opsian/PerformanceProblemsExample
In this guide we’ve seen how profiling and flame graphs could lead to a 25 fold reduction in response time on these kind of example problems and whilst they're just example problems they're based on the kind of real issues we’ve seen users encounter in production. These kinds of improvements make your software more responsive to end-users, reduce operational costs and help you scale to meet your business targets.