How to solve blocking and locking performance problems with profiling
 Richard Warburton
&
Richard Warburton
&
 Sadiq Jaffer
In this screencast we're going to show how to solve blocking and locking performance problems using the Opsian Continuous Profiling service:
Transcript
Welcome to this demonstration of how to solve locking and blocking problems using the Opsian Continuous Profiling service. In this screencast we're going to have a look at two different services. The main service is a Dropwizard-based system which we've specifically developed for this demo scenario.

In the background I'm going to start up a “legacy bank service”. The idea of this example scenario is that we're migrating the bank balances of some of our existing customers from the legacy bank service over to our new bank service. We have a merge account script that's just going to repeatedly hit an http endpoint in order to do account merging and we're going to hit it with several different customer IDs.
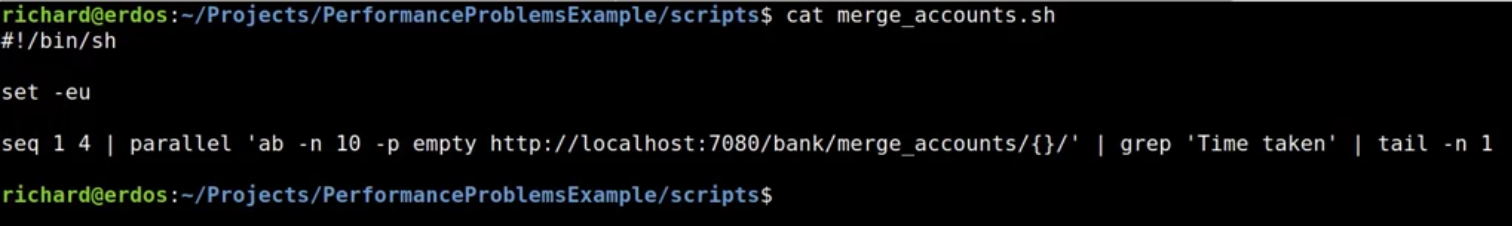
Now we’re going to run that merge accounts benchmark and it will print out the total amount of time taken. We can see the resulting time is about 28 seconds:

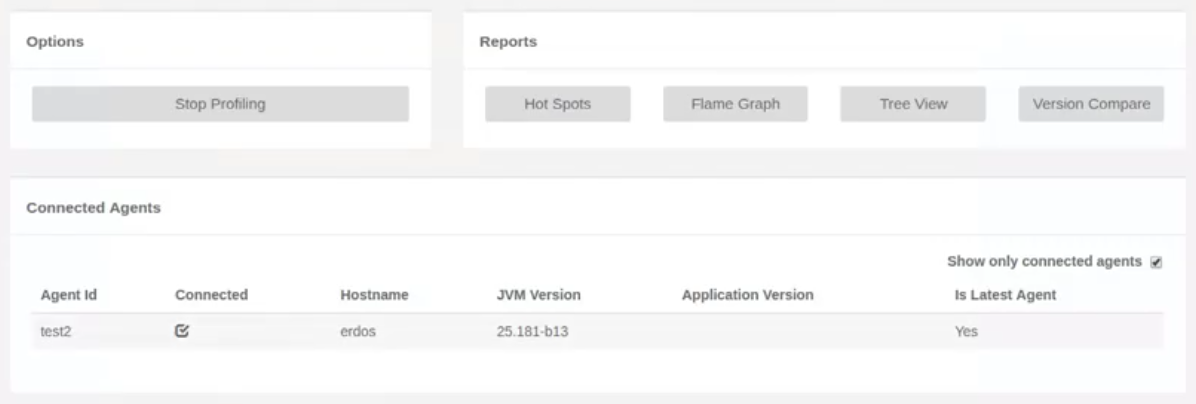
If we flip over to our profiling view and we can see that our little demo application has popped up in the Opsian UI and we're going to take a look at some of the profiling data:
Let’s see what's happened during our recent merge accounts run:
Initially if we just looked at our regular profiling view nothing in particular would jump out and that's because there are a few different types of timing data that we can capture with the Opsian profiler: CPU time and Wallclock time.
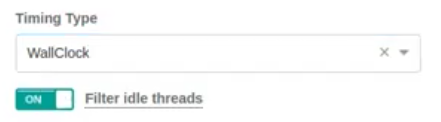
What is the difference between the two? CPU time measures what your application is doing when it is actually executing instructions on CPU whereas Wallclock time measures what your application is doing regardless of whether it is currently executing instructions. This means it can give visibility into issues that are preventing your application from executing, such as blocking calls or lock contention. Let’s look at a filtered view of Wallclock time:
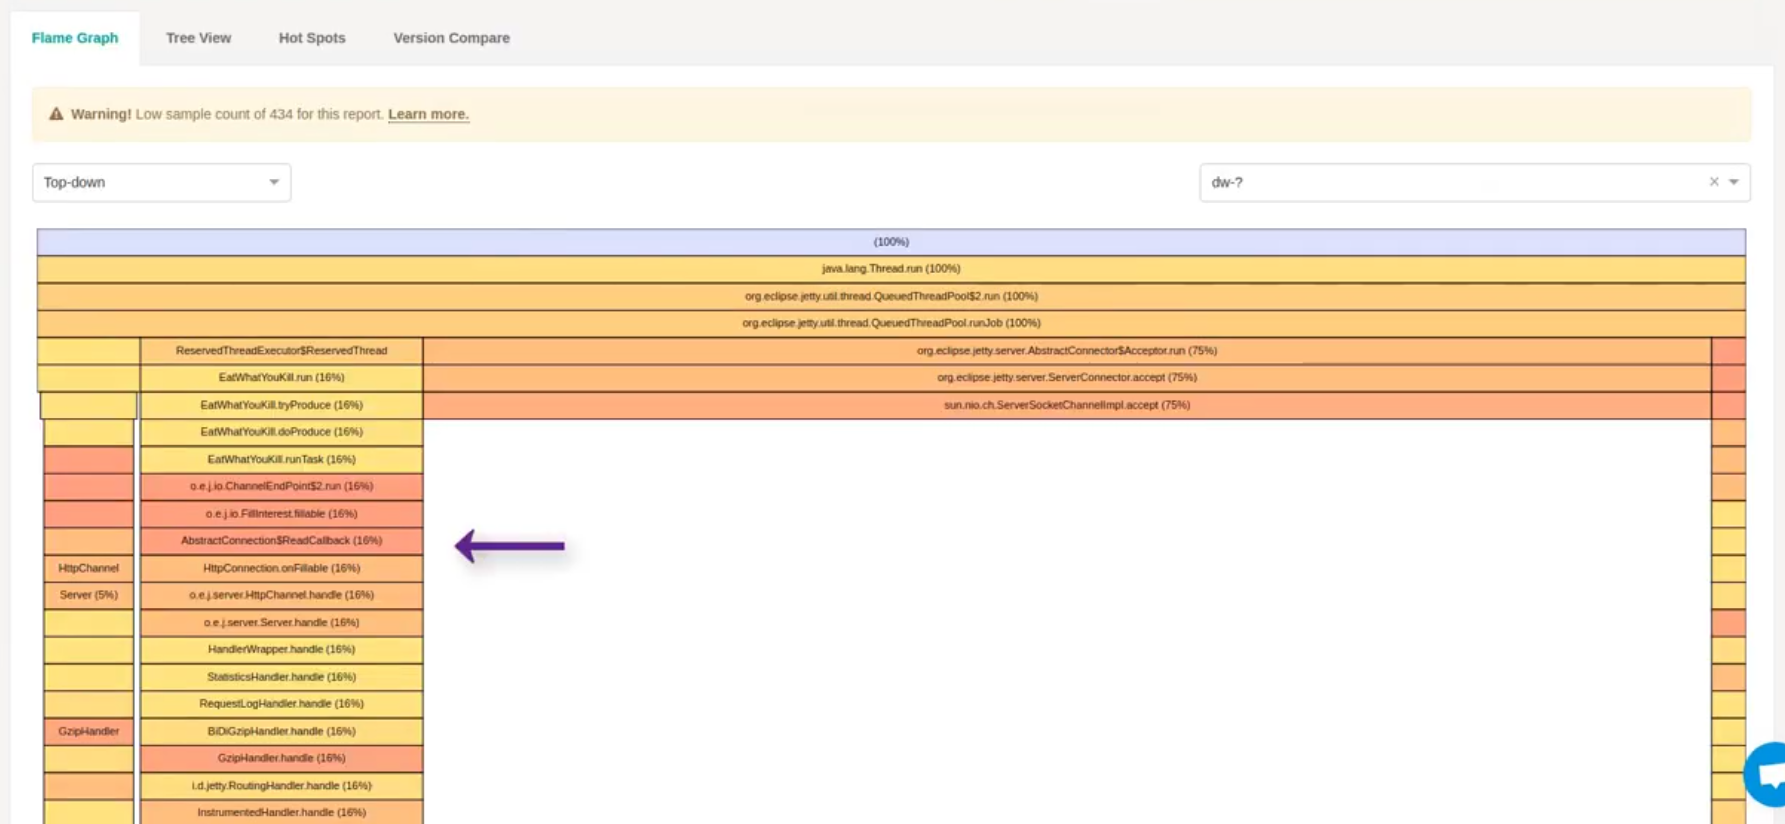
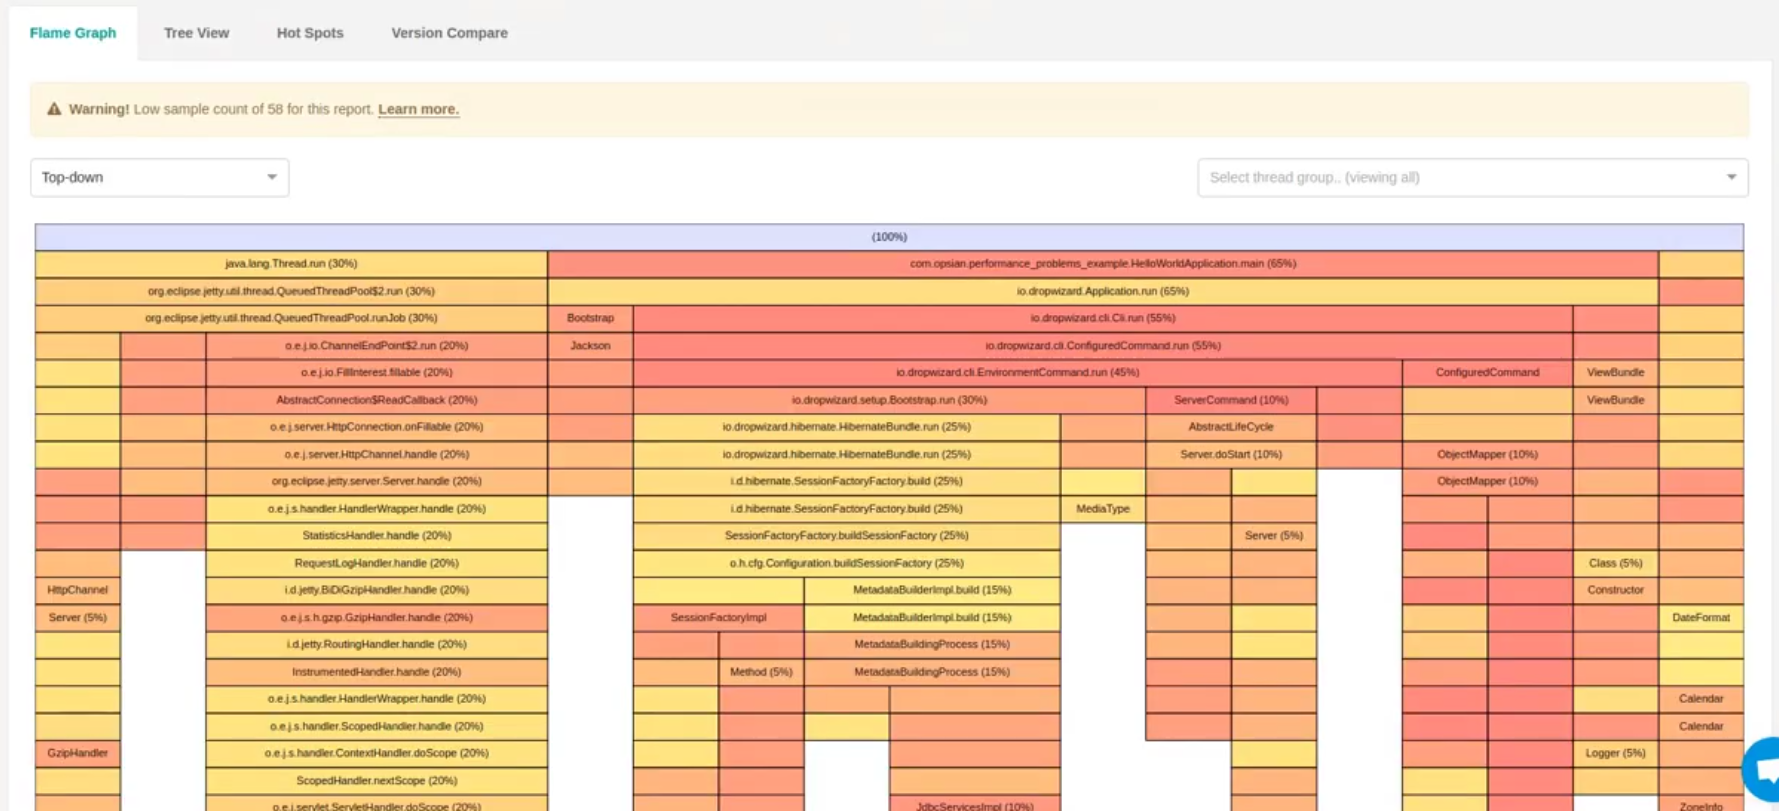
If we run this report we can now see our Dropwizard code in the resulting Flame Graph:
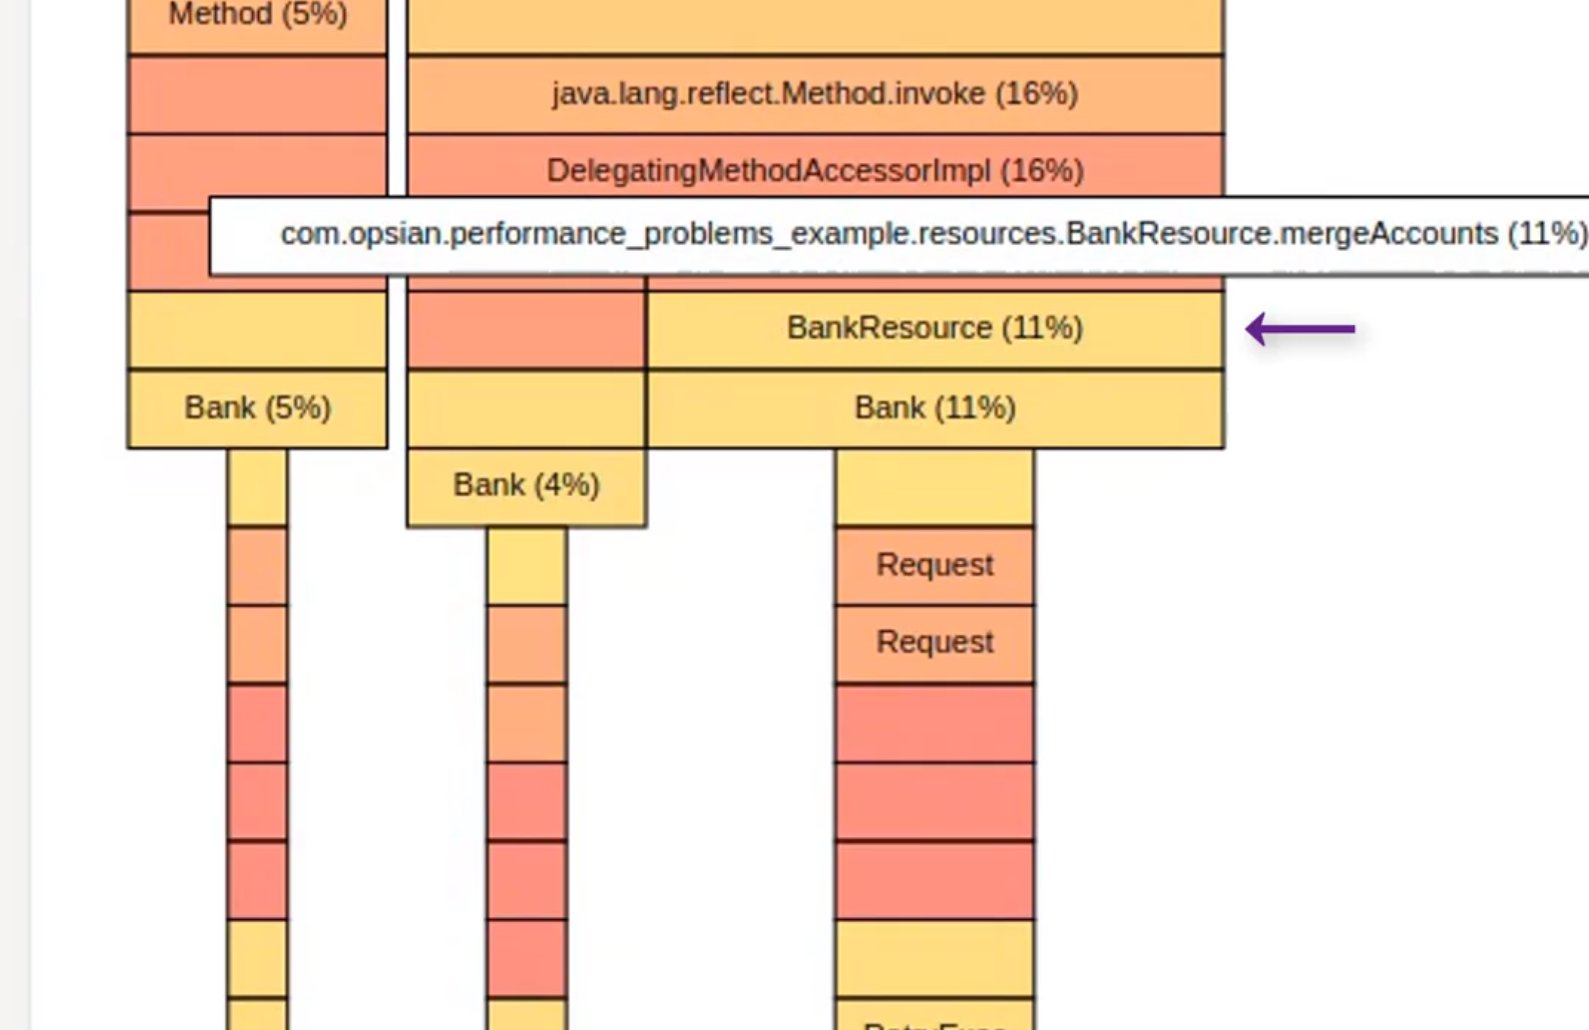
From this zoomed in part of the Flame Graph we can see that BankResource’s
mergeAccounts method is the biggest consumer of time in servicing requests -
taking approximately 70% of Wallclock time. The mergeAccounts method directly
calls the mergeBalanceFromLegacyBankAccount method:
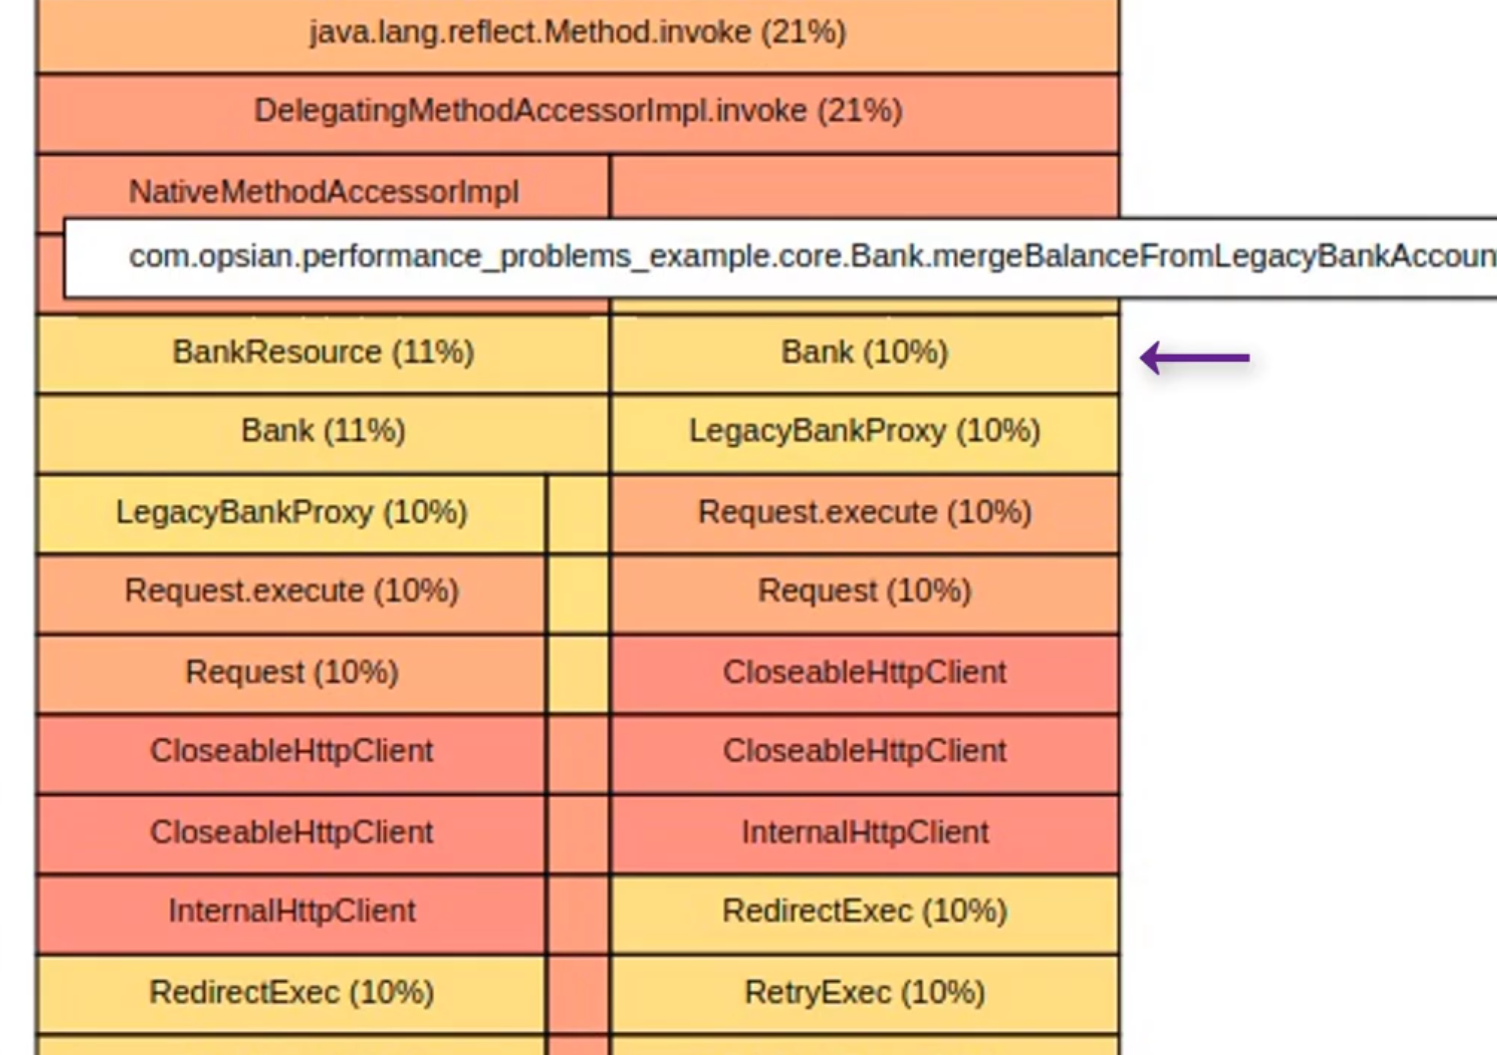
As mergeBalanceFromLegacyBankAccount method’s box is significantly wider than
its children, this indicates that it is the bottleneck and something within the
method is blocking or contended.
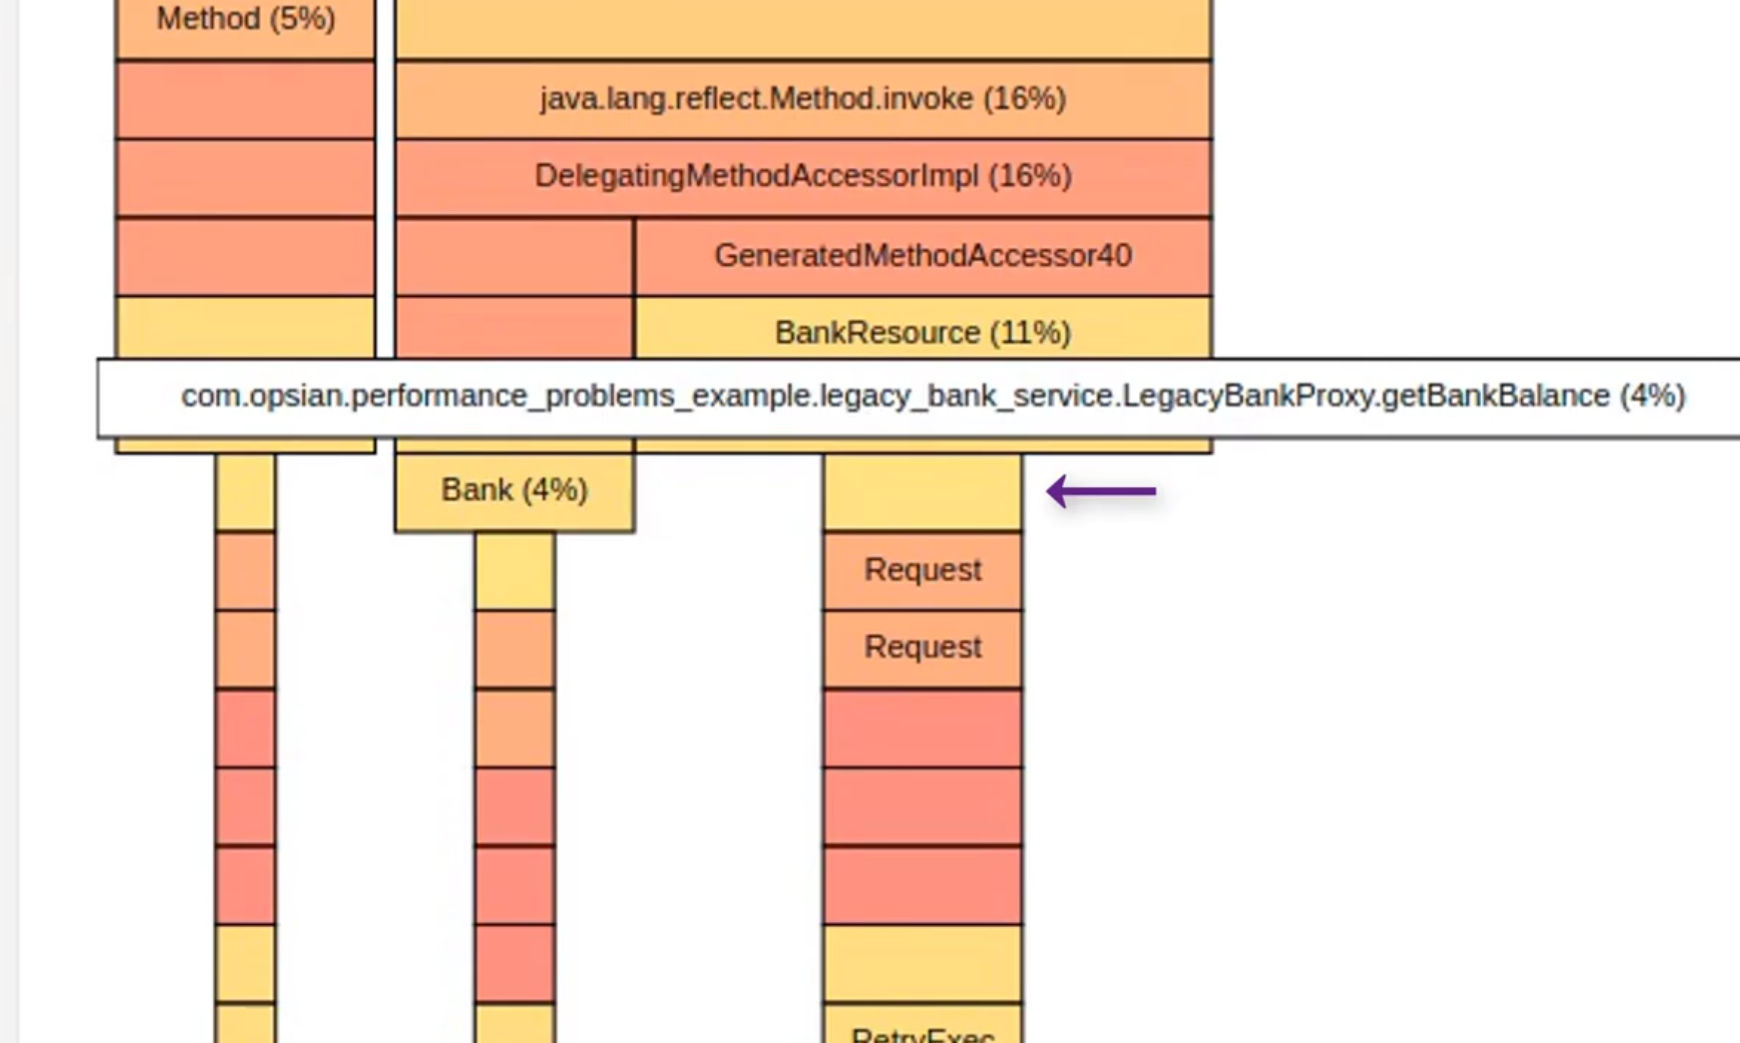
Within mergeBalanceFromLegacyBankAccount there is a LegacyBankProxy.getBankBalance method:
Let's take a look at what that code looks like for mergeBalanceFromLegacyBankAccount:
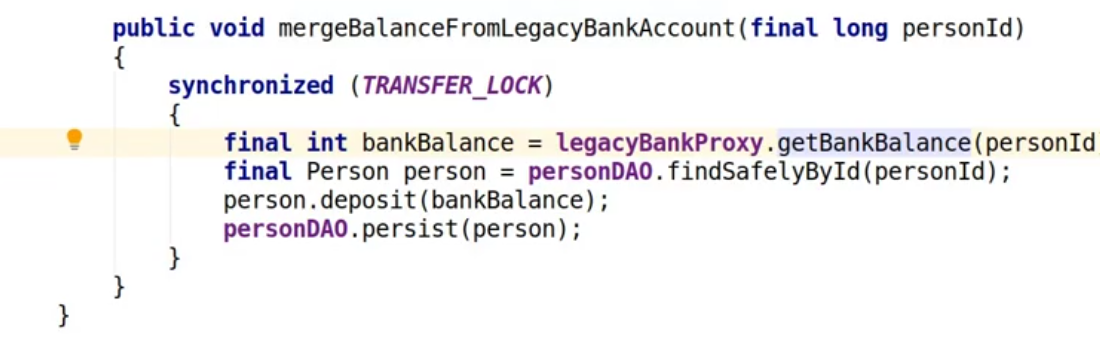
So the method retrieves the customer’s bank balance from the legacy banking
system, then looks up the account holder before depositing the balance in their
account on the new system. What we can see is that the whole method is
synchronized on TRANSFER_LOCK which is a single global lock for the entire
system. This is a problem because it means that all of our threads are
effectively getting serialized to a single point and only one update can happen
at a time.
We can fix this though - we only need to prevent multiple threads from operating the same person concurrently. We can do this by having a lock per person:
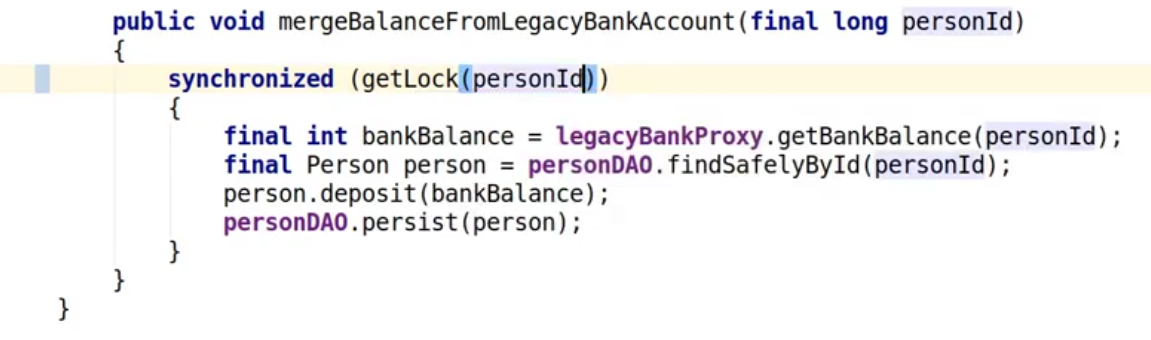
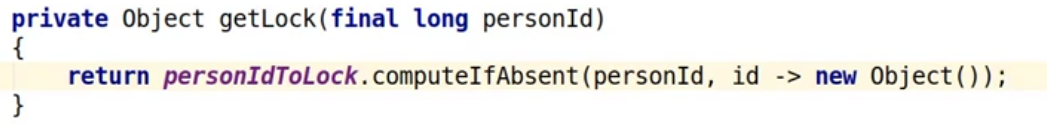
This is a much more fine grained locking strategy but there are other approaches you could use here, like striped locks. Let’s recompile and restart the demo application, then rerun the benchmark script on the updated system.

So last time it was 28 seconds and now we’re down to around 15 seconds, which is a decent improvement.
Let’s see if there are other opportunities to speed things up even more.
Bringing up the Wallclock profiling view, looking at the new Flame Graph and
zooming in to Bank’s mergeAccounts method:
We can see from this we’ve clearly solved the lock contention issue we had
earlier and now all of our time is being spent in the LegacyBankProxy. If we
scroll down we can see that nearly all of that time is spent in
SocketInputStream:
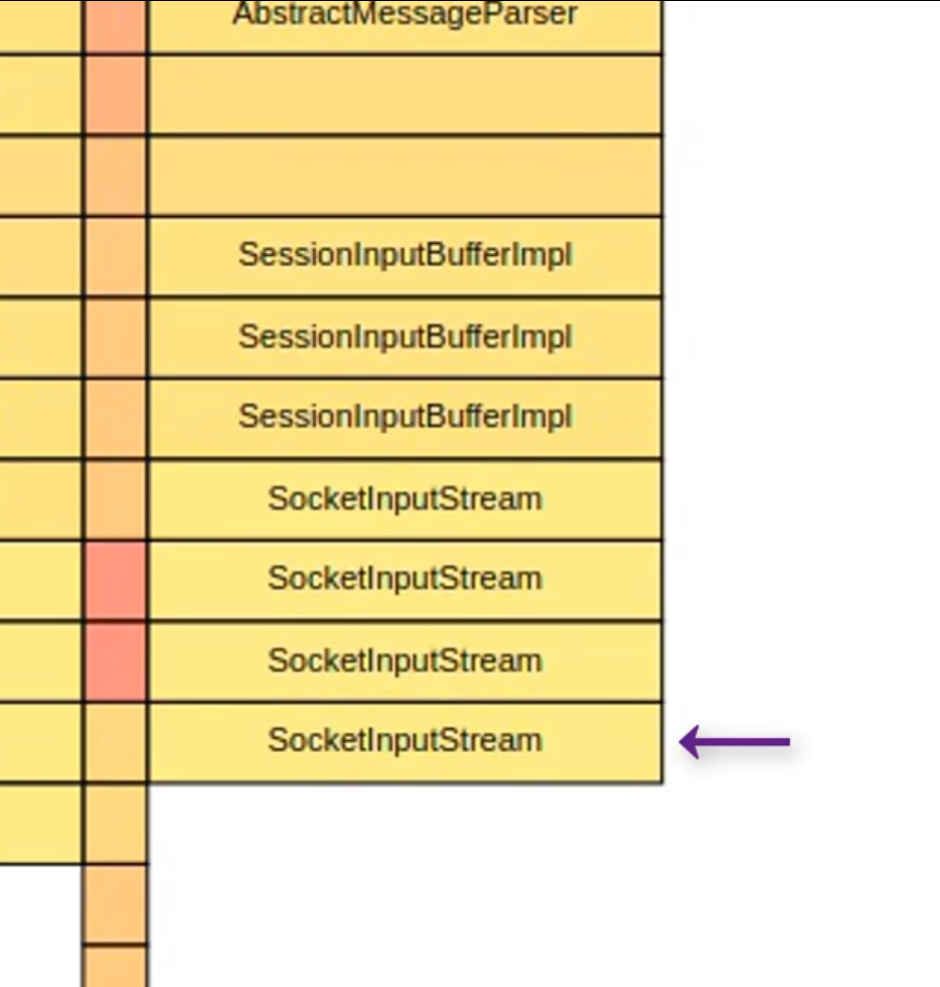
When we see something like this as a large consumer of Wallclock time it means
that we’re waiting on an external request. Now we’d usually use that as a cue
to look at the system on the other end of the request for optimisation
opportunities but since this is just a demo, we can speed up the
LegacyBankService by changing some command line parameters. Now this isn’t
really an effective strategy you can apply in production but it meant to
demonstrate how Wallclock profiling can be used to identify bottlenecks in
other systems.
After we change the LegacyBankingService to speed it up, we can rerun our benchmark:

Much much faster.
So in this demo we looked at a couple of different things. We looked at how you could see a lock within a profiling view that we were able to optimize away as a problem by
Using a more fine-grained locking strategy. We then were able to find an example where the system was waiting on an external service which was a bottleneck.
If you want to take a look at these demos they are available on github.