What is profiling and how does it work? - Profiling In Production Series #1
In this blog post we’re going to look at performance profiling. What it is and how it works. This is the first post in our series on Profiling in Production, by the end of the series you’ll have an understanding of how profilers work, which ones are safe and efficient in production, how to read and interpret the data they produce and finally, how to use this knowledge to keep on top of performance.
So to kick things off, what exactly is profiling? Profiling is the measurement of which parts of your application are consuming a particular computational resource of interest. This could be which methods are using the most CPU time, which lines allocate the most objects, where your CPU cache misses are coming from, etc..
There are two predominant ways profilers are implemented. The first and earliest type are instrumenting profilers. They work by instrumenting the program under test in order to collect information about the resource of interest. For example if you wanted to calculate how much time methods were taking to execute an instrumenting profiler would add instructions to the beginning and end of each method to capture the current time which could then be used to reconstruct the duration spent inside each method.
The problem with instrumenting profilers is that the instrumentation code changes the behaviour of the program significantly and how the program is affected depends on its structure. Imagine two codebases performing the same functionality but with one with sprawling thousand line long methods and the other in many more small methods. For the method timing example earlier, the effect on the former codebase would be significantly different from that of the latter because it needs to run significantly more instrumentation code. This fundamental issue makes instrumenting profilers inaccurate. The instrumentation code also tends to slow the program down a lot which has meant these types of profilers are not as dominant as they once were.
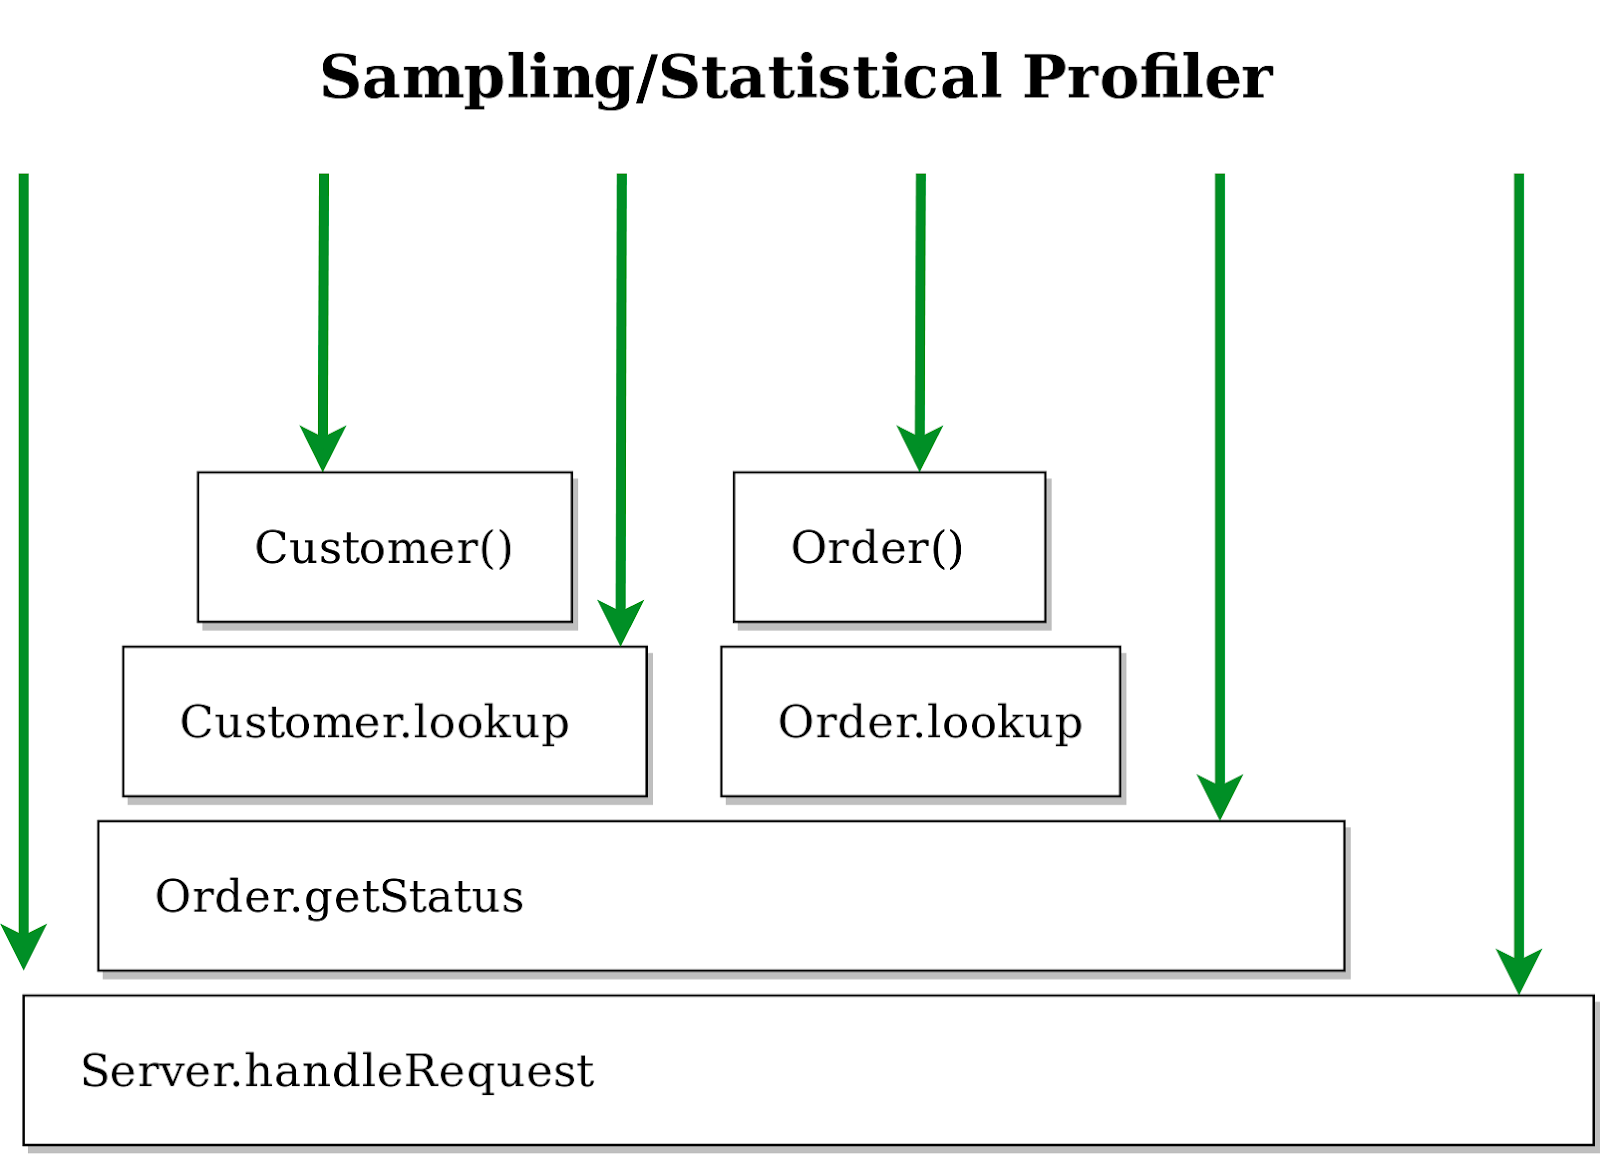
The most common type of profiler is the sampling profiler. They work by interrupting the application under test periodically in proportion to the consumption of the resource we’re interested in. While the program is interrupted the profiler grabs a snapshot of its current state, which includes where in the code it is. After the state is captured the program continues. For the method timing example earlier, a sampling profiler would interrupt the program after a certain amount of time had elapsed and capture its state. It would then aggregate those samples over time to produce a statistical picture of the state of the application. You could use the percent of samples that contained a method of interest to calculate how much time was spent in that method (though not the duration of that method).

The above is an example of an idealised sampling profiler. The black boxes represent the call stack, a box above is called by a box below, and the green lines indicate the points at which the profiler interrupts and captures the call stack of the application. Our first sample would be in Server.handleRequest(), the second sample would show us being in the Customer constructor with a stack trace as follows:
Customer()
Customer.lookup()
Order.getStatus()
Server.handleRequest()
In contrast to instrumentation, profiling by sampling has two main forms of overhead - the frequency with which we stop the application and the cost of stopping the application along with capturing its state. Both of these are independent of the actual structure of the application we’re testing, so we don’t have the same fundamental accuracy problem we had with instrumentation.
We also have some control over the frequency we stop the application, so we can choose the level of overhead that a sampling profiler has. Obviously if the cost of stopping the application is high then we need a very low sampling frequency to maintain a low overhead but with a reasonably cheap mechanism for stopping the application we can profile at high frequencies with very low overhead.
To summarise what you’ve covered in this post, there are predominantly two types of profilers: instrumenting and sampling. The former adds instrumentation to collect data but in doing so changes the behaviour of the application. _Sampling _doesn’t change the behaviour of the application but gives you a statistical aggregation of the data instead.
In the next post you’re going to see how there’s more than just one type of time when it comes to profiling and why looking at the right timing type can be a crucial part of solving a performance issue.
 Sadiq Jaffer
&
 Richard Warburton