Meltdown: What’s the performance impact and how to minimise it?
The internet is abuzz with terms like Meltdown, KAISER and KPTI at the moment. On Twitter, there are post-patching CPU graphs showing all kinds of things. Some developers we’ve spoken to are wondering what all the fuss is about as their systems are barely affected. In this post we set out to find what the real impact of these patches are. We’ve got a couple of practical recommendations at the end that can really make a difference to your system.
We’ve started carrying out tests over the weekend but thought some of the earlier and more general results would be useful to share. It’s worth pointing out that these results are limited to bare metal environments, your mileage may vary on virtualized instances.
What is Page Table Isolation? (PTI or KPTI)
This is the formal name for the latest iterations on the patchset nicknamed KAISER. In the past, kernel memory would be mapped into every processes’ page table for efficiency reasons and the MMU was relied upon to prohibit access to it from user space. With Meltdown though, kernel memory data can be leaked from an application through exploiting design flaws in most Intel CPU’s speculative execution. Full details can be found at the official website.
In short, Page Table Isolation mitigates the Meltdown vulnerability by separating the user-space and kernel page tables. Kernel memory data can’t leak as processes have no physical way of accessing it.
Ok, but how does it work?
Page tables are large and often expensive to access each instruction, so nearly all processors contain one or more caches called Translation Lookaside Buffers (TLBs) which store recently accessed address mappings.
As the processor switches context from kernel to user space, the cache entries that map to kernel memory need to be made inaccessible. A naive way of doing that would be associate all of the kernel’s page tables at the beginning of a method call that goes into the kernel (syscall) and remove them at the end. This would be hugely expensive and pretty much guarantee a lot of TLB misses both sides of a syscall.
Process-Context Identifiers (PCID) enables us to achieve the same goal of isolation much more efficiently by associating some data with each TLB entry which the processor uses to control access to the mappings. By changing the PCID during the mode switch, TLB entries with the kernel’s PCID will not be accessible from user space. Without PCID the TLB needs to be flushed and like any mass cache invalidation, what follows is often a series of expensive cache misses.
There’s a great email to the Mechanical Sympathy mailing list by Gil Tene that describes this issue in more detail.
Testing Setup
We set up a bare metal (E3-1270v6, 32GB ram) server, then built and installed the 4.15-rc6 Linux kernel.
We verified Page Table Isolation was enabled by checking dmesg:
[ 0.000000] Kernel/User page tables isolation: enabled
Next we cloned TechEmpower’s FrameworkBenchmark repository and got one of the consistently fastest Java frameworks, rapidoid-http-fast, up and running. We also added our Opsian profiling agent to the JVM invocation. On a second server we installed wrk.
Tests
Now a lot of people posting about the impact of Meltdown on twitter have just shown CPU graphs - do our servers use more or less CPU? What we measure here is throughput numbers - can we process more or less operations/second with it on or off.
We did three sets of tests. The first with Page Table Isolation off and Process-Context Identifiers (PCID) on, the second with PTI on and PCID on and the third with PTI on but PCID off. PTI and PCID were enabled/disabled through the use of the kernel boot parameters nopti and nopcid respectively. We ran wrk with 8 threads and 1024 connections for 5 minutes at a time against both the /plaintext and /json server endpoints.
Results (in requests/second)
| Endpoint | PTI=off, PCID=on | PTI=on, PCID=on | PTI=on, PCID=off |
|---|---|---|---|
| /plaintext | 1,336,579 | 1,232,020 (-8.5%) | 987,231 (-35.4%) |
| /json | 1,241,743 | 1,122,305 (-10.6%) | 864,463 (-43.6%) |
From these preliminary tests it seems like the impact for JVM network servers doing request-response with non-trivial amounts of actual computation should be bad but not overwhelmingly bad with PTI and PCID enabled. It’s worth bearing in mind that these benchmarks are very syscall heavy - plaintext spends over 60% of its CPU time in the kernel - and are at the worse end of the spectrum in terms of what you should expect.
However the story for environments with PCID disabled is pretty grim. Syscall costs start to become pretty significant and worse, the necessity of flushing the TLB twice per call means performance for both the syscall and subsequent code is hit by many TLB misses.
We passed Opsian’s agent a different application version for each run, which allowed us to do a side by side comparison of the profiling analyses.
As you can see from the first benchmark (PTI=off, PCID=on) run’s Flame Graph, the server spends virtually all of it’s time reading from and writing to connection, as well as adding and removing connections from EPoll. The other benchmark runs Flame Graphs look similar:

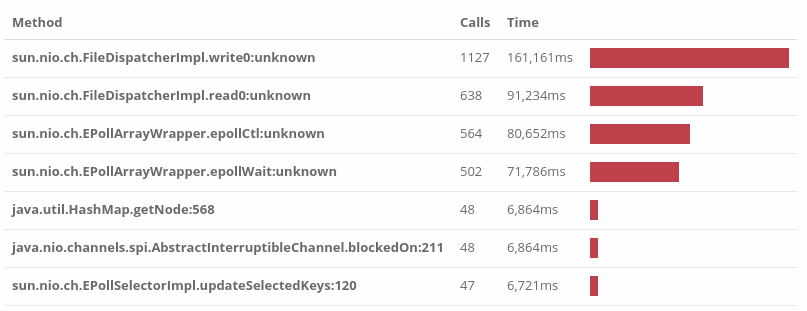
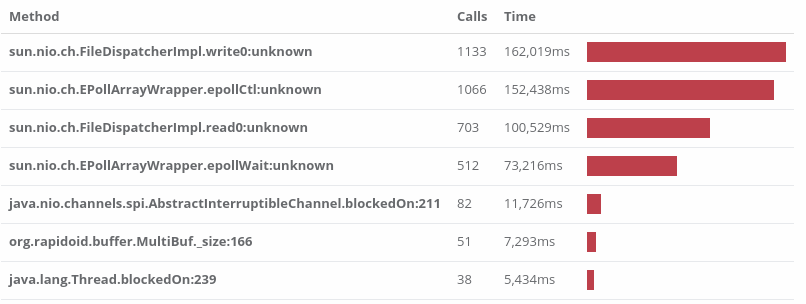
We pulled up Opsian’s Hotspots analysis and compared PTI=off, PCID=on with PTI=on, PCID=off. A Hotspot analysis aggregates over all the collected profiling stacks and summarises by leaf nodes. Otherwise put, hotspots are the currently executing methods we’re most likely to find the application in at any given point in time. Here are the top Hotspots side by side:


sun.nio.ch.EPollArrayWrapper.epollCtl is a thin wrapper around Linux’s epoll_ctl syscall (unknown means it’s a native method and Opsian currently can’t give line information for native code) and as we can see, it’s suddenly got dramatically more expensive. This means that the application spends a lot more time polling and a lot less time reading and writing.
If you’re worried that running Opsian’s production profiling agent would have skewed the results too much to be reliable we also benchmarked with and without opsian. On this workload we slow down the throughput by < 1% when profiling - which meets our target for impact.
We’re still digging a bit from the data we’ve gathered and adding a few more benchmarks that closer match our production environment but our preliminary conclusions are essentially:
Java network servers doing request-response with non-trivial amounts of processing should see some impact with Page Table Isolation (PTI) on. The impact becomes most painful if you don’t have Process-Context Identifiers (PCID) available and switched on. Your own performance will probably differ from this synthetic benchmark and if your software is less syscall heavy then you will probably notice the impact a lot less.
Recommendations
PCID should be available on any Intel server CPU shipped in the last five to six years (Westmere or newer) but there are a couple of things to watch out for. The feature is only available in 64-bit x86 and the kernel needs to be built with it enabled. We recommend checking your environment to ensure that it’s enabled, you can do this by running cat /proc/cpuinfo | grep pcid. If it produces output then you have PCID enabled, if it produces no output then you don’t have PCID enabled.
When it comes to cloud providers we’ve observed that AWS PV (Para-Virtualized) Hosts don’t seem to have PCID enabled, but that HVM (Hardware Virtualized) hosts do. Now as we mentioned before our benchmarks here are on bare metal and not on a virtualized environment so you won’t necessarily get the same results. We have had informal discussions with other companies running both PV and HVM AWS instances and they seem to also exhibit a big difference in performance. We can’t definitely say that this is caused by PCID but if you’re using AWS we strongly recommend that you switch over to HVM from PV hosts where possible.
 Sadiq Jaffer
&
 Richard Warburton